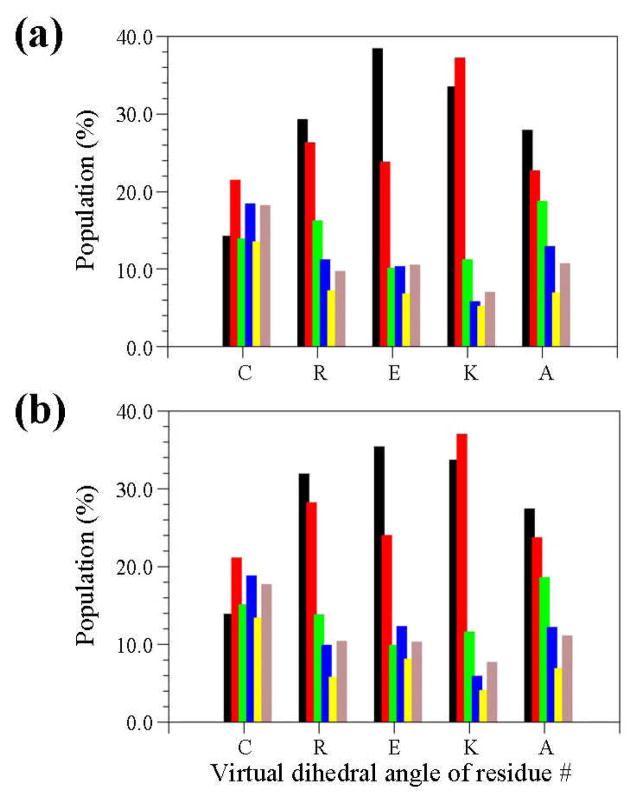
Figure 3.
Distribution of the virtual dihedral angles (see Methods) used to define the conformation of five CREKA residues in all the unique minima obtained for systems I (a) and II (b). Colour code for the bars is: black for dihedral angle values ranging from 0°-to-60°, red from 60°-to-120°, green from 120°-to-180°, blue from 180°-to-240°, yellow from 240°-to-300° and grey from 300°-to-360°.

