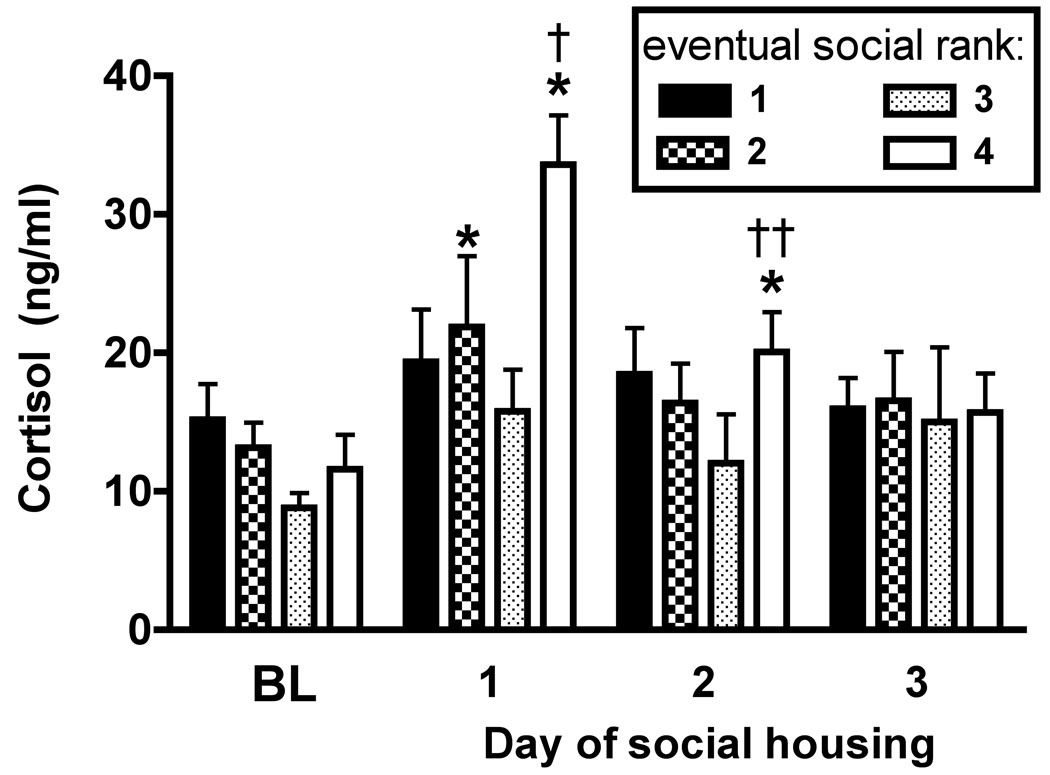
Figure 3.
PM cortisol concentrations at baseline and after each of the first three days of social housing. Points represent mean (+S.E.M., n=4) across social ranks. *, p<0.05 compared to baseline for the same rank; †, p<0.01 compared to #1-, #2-, and #3-ranked monkeys on Day 1; ††, p<0.05 compared to #3-ranked monkeys on Day 2.

