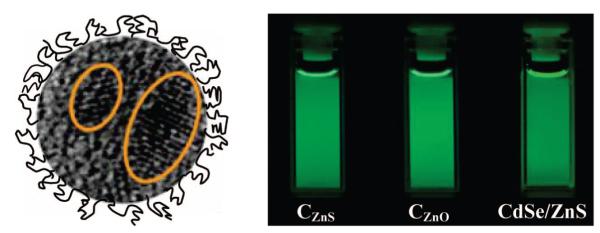
Figure 1.
Left: cartoon illustration on carbon dots with a doped carbon core (from an experimental HR-TEM image with ZnS lattice fringes circled). Right: aqueous solutions of CZnS-Dots and CZnO-Dots (450 nm excitation for both) compared with a commercial toluene solution of CdSe/ZnS dots (matching optical density at excitation), all photographed through a 475 nm cutoff filter.

