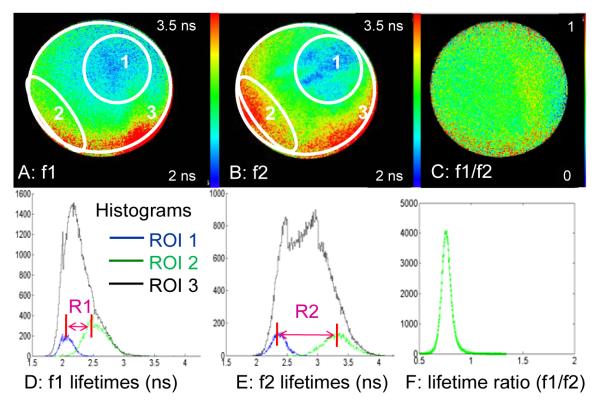
Figure 1.
A and B) Average lifetime images from filters 1 (377 nm) and 2 (460 nm). The white lines show the regions of interest (ROIs) selected for the histograms in D & E. ROI1 is the area of shortest lifetime, ROI2 the area of longest lifetime, and ROI3 the entire image. C) Ratio of images A and B. To quantify these images we calculate the ratio of ranges of lifetimes between f1 and f2. D and E) Histograms of lifetimes from f1 and f2, R1 and R2 represent the distances between the shortest and longest lifetimes in each image. For this image set, the ratios of ranges from f1 and f2 is R1/R2 ∼ 0.5. F) Histogram of the ratio image C In this case the ratio values are all less than 1

