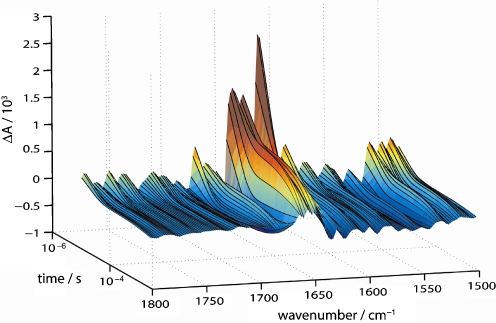
Fig. 6.
Time course of the FT-IR difference spectra of CO recombination to myoglobin. The spectral range is 1,800–1,500 cm−1 and covers the amide I and amide II vibrational bands. The time range of 10 μs to 2.5 ms is plotted on the logarithmic scale. Data shown are those reconstructed from fitting the absorbance changes to a sum of three exponentials (see text for details on the global fitting analysis)

