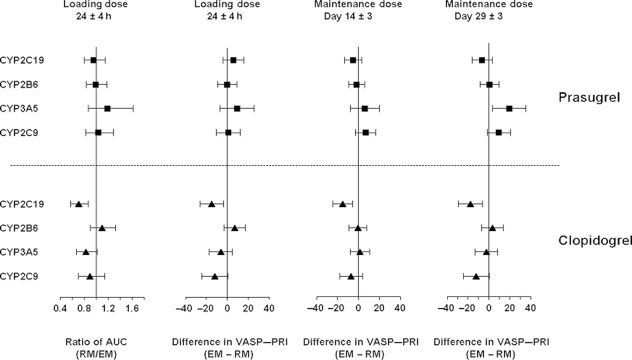
Figure 2.
Ratio RM/EM or difference (EM − RM) for pharmacokinetics and pharmacodynamic responses for CYP2C19, CYP2B6, CYP2C9, and CYP3A5. Mean and 95% confidence interval for ratio (AUC at LD) or difference (VASP–PRI at 24 h post-LD and MD Day 14 and Day 29) is derived from a linear model and is plotted for each CYP gene. AUC, area under the concentration–time curve; EM, extensive metabolizer; LD, loading dose; MD, maintenance dose; RM, reduced metabolizer; VASP, vasodilator-stimulated phosphoprotein; PRI, platelet reactivity index.

