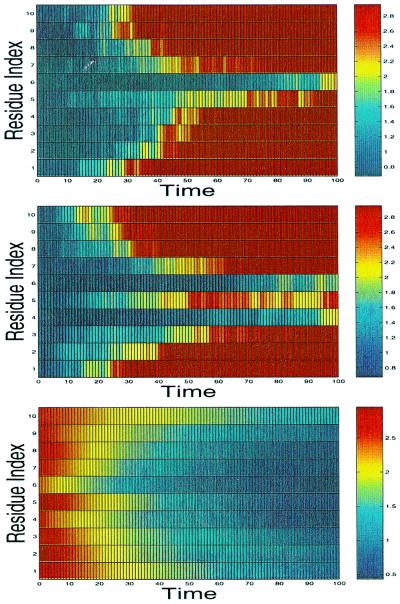
Figure 2.
Two typical heterogeneity-dominant unfolding simulations averaged over 50 hairpins for the single (Top) and double (Middle) heterogeneity case. The system starts in the native state, and the parameters are chosen to lie above the crossover curve in Fig. 4a (kBT/V1 = 0.19, δV1 = 0.4V1) and Fig. 5a (kBT/V1 = 0.192, δV1 = V2 = 0.3 V1). (Bottom) The typical heterogeneity-dominant folding in the double-heterogeneity case (kBT/V1 = 0.13, δV1 = V2 = 0.4V1), performed by temperature quenching. The local interstrand distance at residue i is defined as the average of 〈|x⃗i|〉/r0 and indicated by the color map (deep blue, folded; red, totally unfolded; dark red, 〈|x⃗i|〉/r0 ≥ 3.0). Time is in arbitrary units.

