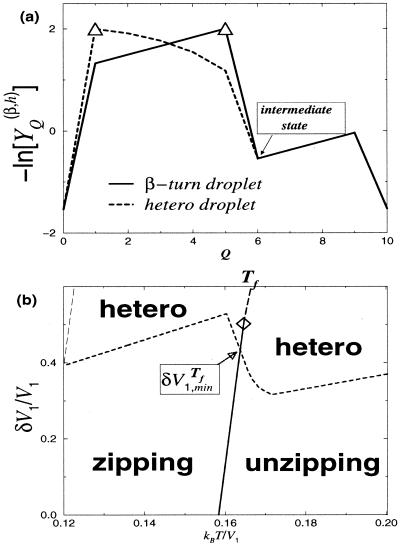
Figure 4.
(a) The typical free energy profiles for the β-turn and hetero-droplets at a Tf point indicated by the hollow arrow in b, in the single heterogeneity case. The barriers encountered in transition states are indicated by Δ. Here n = 10, γ = 3, σ = 1, V2 = 0, and ν0 = 10−4. (b) The typical crossover diagram. The solid curve is Tf for transitions between the coil and complete hairpin states; above ◊, the transition is instead between the coil and a partially folded ensemble (the long-dashed curve). The crossover is indicated by the dashed curve. The thin long-dashed curve indicates where the barriers disappear.

