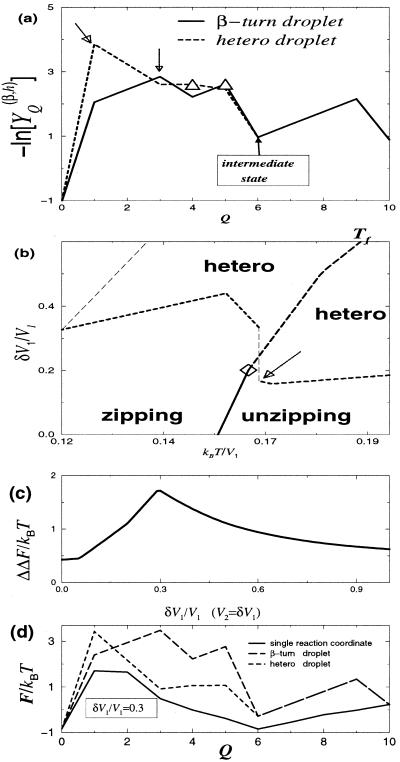
Figure 5.
(a) The typical free energy profiles for the hetero- and β-turn droplets at a Tf point indicated by the hollow arrow in b, in the double heterogeneity case. The barriers for the unfolding transition are indicated by Δ. Note that the folding barrier (the hollow arrow) is different from the unfolding one in the hetero-droplet. Here n = 10, γ = 3, ν = 10−4, and δV1 = V2 = 0.4V1. (b) The typical crossover diagram. The solid curve, the ◊, and the long-dashed curve have the same meanings as in Fig. 4. Because the rate-limiting barriers are different for un/folding, there is a “discontinuity” (jump) in the crossover curve (indicated by the hollow arrow). (c) The difference ΔΔF = ΔFd − ΔFQ between the droplet analysis (ΔFd) and the single reaction coordinate landscape (ΔFQ) as a function of heterogeneity strength; this curve is based on data of the type shown in d for the specific value δV1 = V2 = 0.3V1. Note that the droplet analysis, although dependent on a single coordinate Q, does not lump together all states with a given number of contacts.

