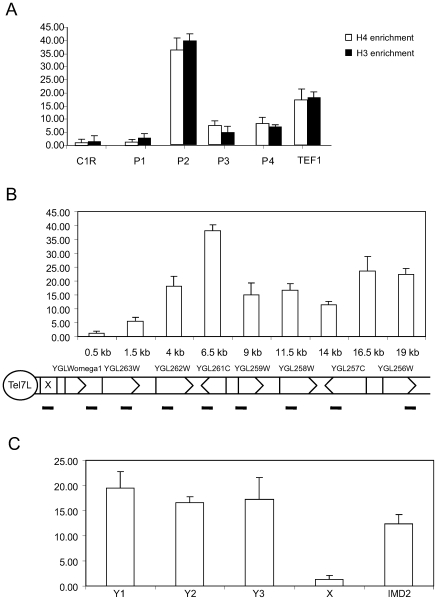
Figure 1. ChIP analysis of histone H3 and H4 occupancy at chromosome ends.
A. Precipitated DNA was quantified by real-time PCR using primer pairs amplifying X elements (C1R, P1, P3, and P4) or Y' elements (P2). A primer pair amplifying the TEF1 coding region was used as a euchromatin control. Error bars show standard deviations. B. Histone H3 occupancy at Tel7L, which contains an X element, but no Y' element. Precipitated DNA was quantified by real-time PCR using primer pairs covering the indicated positions. Error bars show standard deviations. C. High histone H3 occupancy at different positions on the Y' element. As a control we measured H3 occupancy at X elements and at the subtelomeric IMD2 gene. The analysis was as described for panel B.

