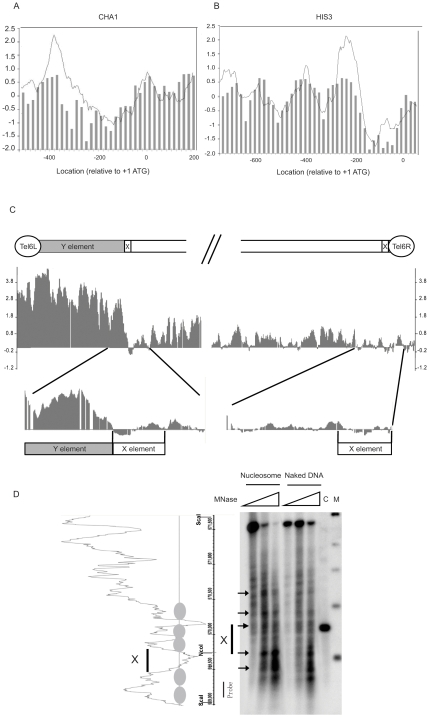
Figure 2. High resolution profiling of nucleosome positioning near telomeres.
A and B. A comparison between our tilling array data and previously reported nucleosome positions. The Y axis is log2 and each bar represents enrichment in the immunoprecipitated nucleosome fraction relative to a naked DNA control sample. The X axis represents the distance to ATG. Bars present data from Yuan et al., 2005, which corresponds to median normalized ChIP-chip values for nucleosome occupancy. The grey traces are our nucleosome positioning data based on DNA microarray analysis of the indicated regions. Panel A shows the CHA1 promoter and Panel B shows the HIS3 promoter. C. High nucleosome occupancy was seen on the Y' element of Tel6L, whereas low occupancy was seen on the X elements of both Tel6L and Tel6R. D. Micrococcal nuclease mapping of nucleosomes at the right end of chromosome V. The left panel indicates the nucleosome distribution from tiling array data. The position ruler indicates the Sca I and Nco I sites as well as the location of the radioactive probe used for Southern hybridization. The right panel demonstrates micrococcal nuclease mapping data for the corresponding region. Microcoocal nuclease (0, 2, and 4 units) were used for digestion of nucleosomal DNA and the naked DNA control. Lane C contains genomic DNA digested by Sca I and Nco I, to localize the X-element region. Lane M contains a DNA size marker (500 bp, 1 kb, 1.5 kb, 2 kb, and 3 kb). The black bar indicates the location of the X element region.

