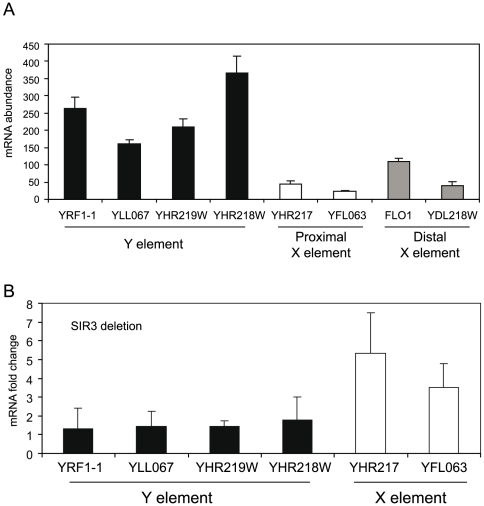
Figure 5. Y' elements are transcriptionally active, whereas X elements are repressed.
A. mRNA quantification of different subtelomeric ORFs. Randomly selected genes located in X and Y' elements are displayed. Error bars show standard deviations. B. Deletion of SIR3 leads to derepression of X element genes, but does not affect genes located to Y' elements. The fold change of transcription in wt and sir3 cells are indicated. Error bars show standard deviations.

