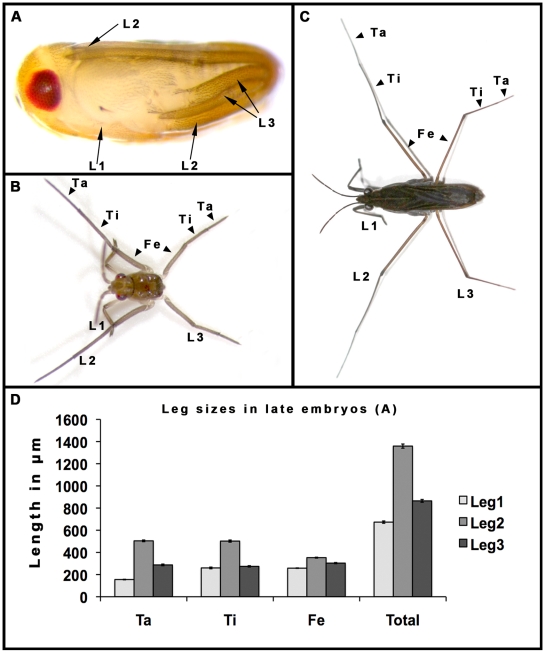
Figure 2. Leg arrangement, morphology, and size during various stages of G. buenoi ontogenesis.
(A) Late embryo prior to hatching. L1 legs extend ventrally across the abdomen, to reach the junction between the femur and the tibia of L2. Both L2 legs extend in parallel in a ventral-to-dorsal arrangement and the tips of their tarsi reach the head of the embryo (L2 arrow). L3 legs, however, cross each other to extend in a lateral-to-lateral arrangement and the tips of their tarsi are tucked laterally between the proximal bases of L2 and L3 (L3 arrows). (B) First instar larva showing the differential sizes of the segments in each leg. Note the dramatic size elongation in L2 compared to L1 and L3. (C) G. buenoi adult female showing similar differences in the overall sizes of the legs compared to the larva. (D) Morphometric measurements of appendage sizes in the late embryonic stage, captured in (A). Data are expressed as means±SD. Note that the Tarsus (Ta), Tibia (Ti), and Femur (Fe) in L2 an L3 are the segments that are the most elongated. The average size variation is significantly different between the three appendages (F2,27 = 5866.264, P<0.05). The dynamics of growth of leg segments changes throughout ontogenesis (not shown). The tarsus and tibia of L2 are not significantly different in size (F1, 18 = 0.367, P = 0.552) and are both significantly longer than the femur (F1, 18 = 2526.094, P<0.01). In the adult, the femur of L2 is significantly longer than the tibia (F1, 18 = 15.533, P<0.025; Figure 2D), which is in turn significantly longer than the tarsus (F1, 18 = 50.522, P<0.001; Figure 2D). In L3 however, the tarsus is significantly longer than the tibia and significantly shorter than the femur throughout G. buenoi ontogenesis (F2, 27 = 55.308, P<0.01).

