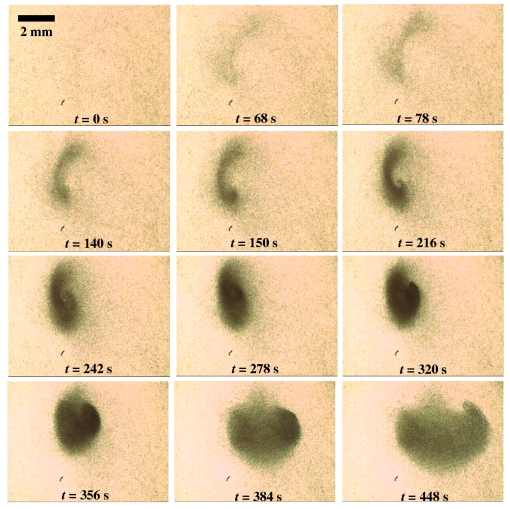
Figure 5.
Successive images obtained by high speed video microscopy at 60 frames∕s showing the spiral-like trajectory of the RBCs near the bottom of the microfluidic chamber toward a stagnation point. The applied field and frequency are 286 kV∕m and 60 kHz, respectively, and the initial hematocrit is 0.4%.

