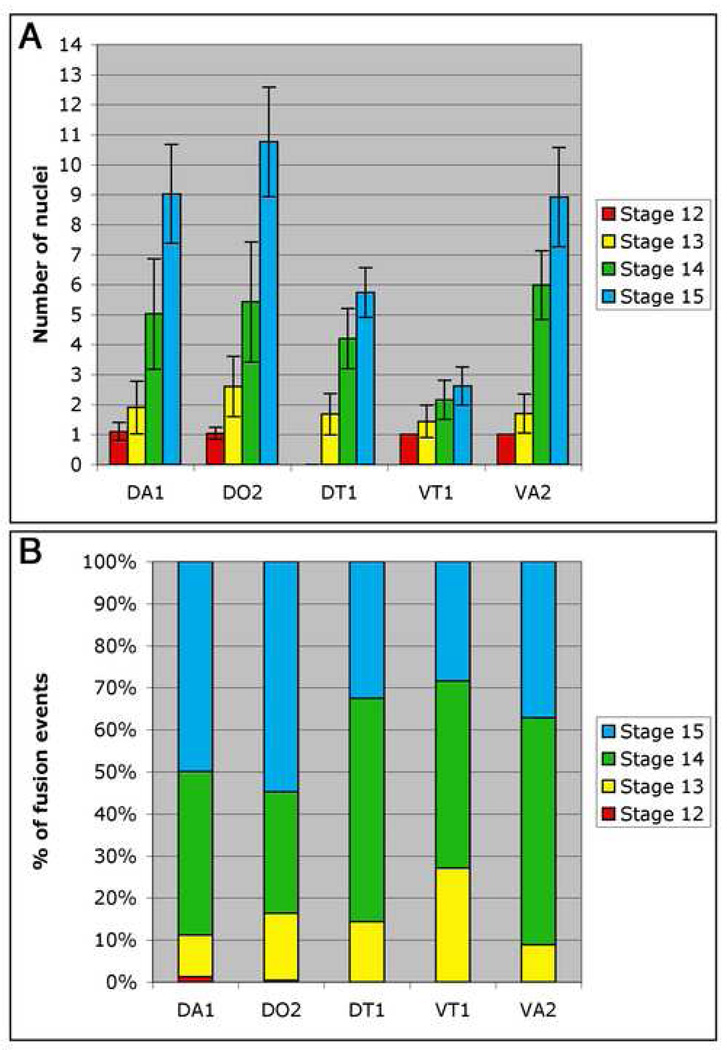
Figure 5. Wild type fusion profiles of individual muscles.
Wild type stage 12–15 embryos were stained with antibodies against Eve (DA1), Runt (DO2) or Slouch (DT1, VT1 and VA2) in combination with phalloidin to assist accurate staging. The number of nuclei for each muscle and stage were counted in 50 hemisegments (A2–4). (A) Bar graph showing the mean number of nuclei for each muscle at each stage. Error bars show one standard deviation from the mean. For each muscle, the majority of fusion occurs in stages 14–15. The stage 12 value for the DT1 muscle was not determined due to an inability to detect Slouch expression. (B) Histogram showing the percentage of fusion events that occur during each stage for each muscle during the course of fusion (7.5–13 hours AEL). The mean number of nuclei observed for each muscle at stage 15 is 100% and a single nucleus is 0%. The numbers used to plot this graph are shown in Supplemental Table 1. 9–27% of fusion occurs during stages 12–13 (7.5–10.5 hours AEL), while the remaining 73–91% of fusion occurs during stages 14–15 (10.5–13 hours AEL).

