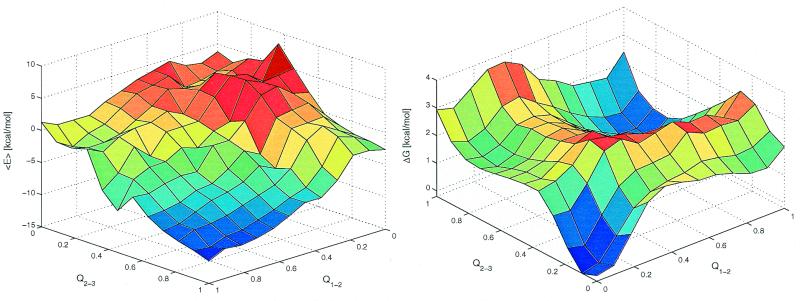
Figure 6.
Same as in Fig. 5 for the four simulations at 330 K. A total of 0.77 × 10⁵ conformations were used. The minimum and maximum values of Nn,m are 19 and 4531, respectively. The average and maximal error of <E> are 1.9 and 7.5 kcal/mol (bin with n = 11 and m = 2), respectively. The average and maximal errors of ΔG are 0.6 and 1.8 kcal/mol (n = 0, m = 5), respectively.

