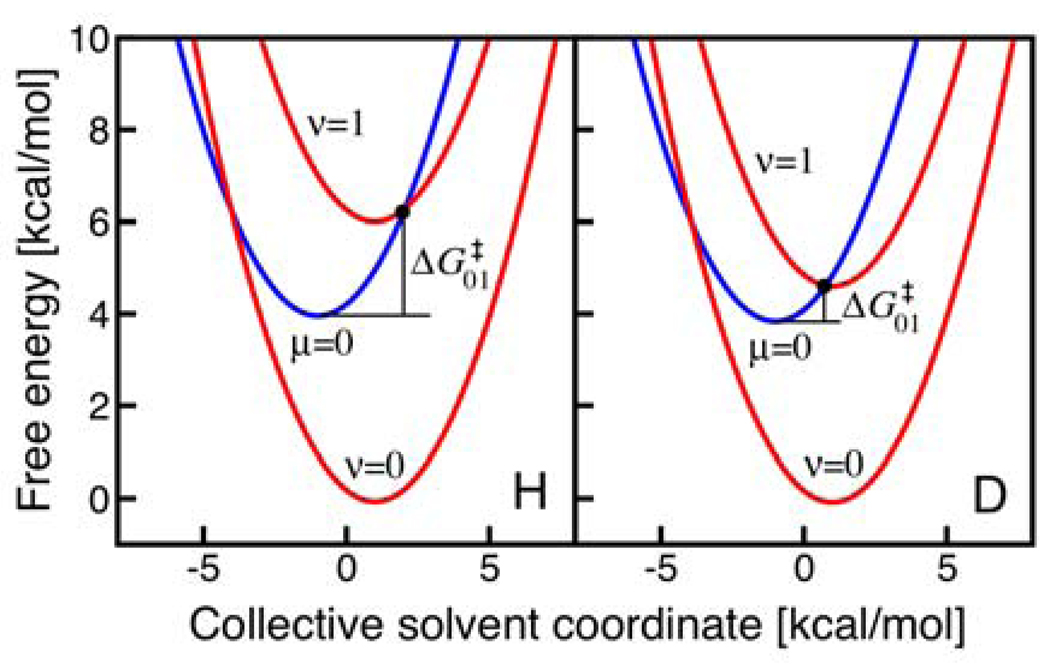
Figure 6.
Free energy curves as functions of a collective solvent coordinate for the UQH2 system. The lowest energy reactant vibronic state (blue, labeled μ=0) and lowest two product vibronic states (red, labeled ν=0 and ν=1) are shown for H (left) and D (right). Note that all of the states are shifted so that the lowest energy reactant vibronic state has zero energy for both H and D. The relative energies of the μ=0 and ν=0 states are identical for H and D because the same value of ΔG0 is used for both H and D. As discussed in the text, this approximation involves the neglect of terms of only ∼0.1 kcal/mol. The free energy barrier for the (0/1) pair of reactant/product vibronic states is smaller for D than for H because of the smaller vibronic energy level splittings for D.

