
Table 2. Membrane Microscopic Events and Transition rates.
| Microscopic Event | Transition Rate |
| Diffusion |
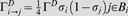
 is the occupancy(discrete) that is 1, if site is the occupancy(discrete) that is 1, if site  is filled, and 0, if site is filled, and 0, if site  is empty (a single index indicating the site is used to simplify notation). is empty (a single index indicating the site is used to simplify notation).  , where , where  is the microscopic lattice pixel dimension taken equal to the encounter radius, and D is the diffusivity of a receptor Bi denotes the set of sites to which diffusion from site i can occur which includes all 4 first-nearest neighboring sites is the microscopic lattice pixel dimension taken equal to the encounter radius, and D is the diffusivity of a receptor Bi denotes the set of sites to which diffusion from site i can occur which includes all 4 first-nearest neighboring sites |
| Reactions | |
| Ligand Association Reaction (SL+M → M*) |
 k is the macroscopic reaction rate constant with units as [s−1]
 |
| Ligand Disassociation Reaction (M* → SL+M) |
 k is the macroscopic reaction rate constant with units as [s−1]
 |
| Dimerization Reaction (M*+M* → D) |
 k is the macroscopic reaction rate constant with units as [(receptors/sites)−1 s−1]
 |
| Decomposition Reaction (D → M*+M* ) |
 k is the macroscopic reaction rate constant with units as [s−1]
 |
| Phosphorylation/Dephosphorylation Reaction (D ↔ pD) |
 k is the macroscopic reaction rate constant with units as [s−1]
 |
| Cytosolic Association Reaction |
 k is the macroscopic reaction rate constant with units as [s−1]
 |
| Cytosolic Disassociation Reaction |
 k is the macroscopic reaction rate constant with units as [s−1]
 |
Γ is defined on a square lattice with lattice species M, monomers, D, dimers, and pD, phosphorylated dimers. Sx are species either within the cytosol SC or in the extracellular space SL. Details are provided in the text.