

Abstract
Oxidized cytochrome c6 from Anabaena PCC 7119 was studied by electron spin echo envelope modulation spectroscopy. Hyperfine couplings of the unpaired electron with several nuclei were detected, in particular those of the nitrogens bound to the iron atom. Combining the experimental information here presented and previous continuous wave-electron paramagnetic resonance and electron nuclear double resonance results, some details on the electronic structure of the heme center in the protein are obtained. These results are discussed on the basis of a molecular model that considers one unpaired electron localized mainly in the iron d orbitals and propagation of the spin density within the heme center via spin polarization of the nitrogen σ-orbitals. The coexistence of two heme forms at physiological pH values in this c-type cytochrome is also discussed taking into account the experimental evidence.
Introduction
Low spin (LS) hemeproteins are involved in many biochemical processes. This is the case of cytochromes, a large and varied group of proteins that function as charge carriers in most of the metabolic electron transfer protein chains where energy transformation takes place. They achieve this functionality by exchanging one electron at the iron atom of the heme center that alternates between the reduced state, Fe(II), and the oxidized one, Fe(III) (1).
The elucidation of the electronic structure of heme centers appears as a critical point in the understanding of the modulation of the mechanisms of reaction involving heme proteins and, therefore, has deserved several studies in the last years. NMR and electron paramagnetic resonance (EPR) techniques have been widely used with this aim (2). NMR provides structural information on both the ferric and ferrous states of cytochrome. For the ferric form, hyperfine couplings are also determined, allowing models for the heme electronic structure to be indirectly derived. Although EPR provides information on only the oxidized Fe(III) state of heme, it allows one to obtain the g-tensor, which is directly determined by the electronic structure of the iron (2,3). Besides, EPR-related techniques such as electron nuclear double resonance (ENDOR) and electron spin echo envelope modulation (ESEEM) spectroscopy have been demonstrated to give valuable information on the hyperfine interactions of the unpaired electron with nitrogen and hydrogen nuclei of the porphyrin ring and axial ligands (2,4–11). To explain the hyperfine coupling detected in NMR, ENDOR, and ESEEM studies, π-bonding of the iron with porphyrin and axial ligands has been assumed (2,6). In contrast, continuous wave (CW)-EPR experiments are properly interpreted on the basis of an unpaired electron in a t2g triplet of localized (rather nonbonding) d iron orbitals (3).
In a previous study, we reported on the characterization of cytochrome c6 from Anabaena PCC 7119 (hereafter, Cyt c6) by CW-EPR and ENDOR (11). Two Cyt c6 forms displaying different EPR spectra were characterized. They were identified as LS and HALS (highly anisotropic low spin) forms. The first one showed g-tensor principal values of gz = 2.96, gy = 2.30, and gx = 1.41, whereas values of gz = 3.32, gy = 1.91, and gx = 0.56 were determined for the second one. These two forms were associated with two different arrangements of the axial ligands of the heme center within the protein. Interestingly, the coexistence of two EPR forms at physiological pH values has been reported in several other c-type cytochromes (12–16), suggesting it might be functionally relevant. In addition, our ENDOR characterization provided information about the hyperfine interactions of the unpaired spin with hydrogen nuclei at the heme site. These studies also indicated spin polarization of the iron environment, as reported in other heme systems (2,4–11). Thus, the picture of the electronic structure of the two Cyt c6 forms can still be improved by detecting the coupling of the unpaired electron to other, still unassigned nuclei in the heme center.
ESEEM, in particular the two-dimensional (2D) correlation technique hyperfine correlation spectroscopy (HYSCORE), has been used in our lab to characterize the LS hemes of both a model compound and the photosystem II cytochrome b559 subunit from spinach (hereafter, Cyt b559) (7). The hyperfine coupling of the unpaired electron with nitrogen nuclei was detected, and the detailed analysis of these HYSCORE features allowed a deeper understanding of the structure and the electronic configuration of those heme centers. A similar methodology was later used by other authors to characterize heme systems (8–10).
Here we present a HYSCORE and ESEEM characterization of Cyt c6 that provides new information on the hyperfine couplings of the unpaired electron with nitrogen nuclei. On the basis of these results and those previously reported from CW-EPR and ENDOR (11), we will analyze the relationship between electronic structure of these heme centers and the origin of the spin density in both the porphyrin ring and the axial ligands. Finally, the nature of the coexistence of the two EPR forms presented by Cyt c6 will also be considered.
Materials and Methods
Protein purification and EPR sample preparation methods were as previously described (11). Once produced, EPR samples were kept in quartz tubes (707-SQ from Wilmad Labglass, Buena, NJ) at liquid nitrogen temperature and transferred into the resonant cavity without significant warming up.
A Bruker (Karlsruhe, Germany) ESP380E spectrometer working at X-band was used for HYSCORE and ESEEM measurements. Spectra were typically performed at ∼6 K by using a liquid helium refrigerated Oxford (Eynsham, UK) CF935 continuous-flow cryostat.
A microwave pulse sequence (π/2-τ-π/2-t-π/2-τ) was used for the 3p one-dimensional (1D) ESEEM experiments; the time t was varied with a sampling interval of 16 ns (Nyquist frequency of 31.25 MHz). For the 2D HYSCORE experiment, a 4p sequence (π/2-τ-π/2-t1-π-t2-π/2-τ) was used, where t1 and t2 were varied independently. Sampling time was 16 ns or 48 ns (Nyquist frequency 31.25 MHz or 10.42 MHz, respectively). The duration of the π/2-pulse was 16 ns for the 3p ESEEM experiments and 24 ns for the 4p experiments, and the inversion π-pulse duration was 16 ns. Typical values of τ were 96 ns and 208 ns for HYSCORE experiments, whereas 1D ESEEM measurements were performed for τ-values of 96 ns, 144 ns, and 208 ns. For every field position, the amplitude of the pulses was adjusted to make them suitable for the above described sequences. Appropriate phase cycling was applied to minimize unwanted echoes.
1D and 2D frequency domain spectra were obtained by processing the time domain spectra with the program WIN-EPR (Bruker). Background contributions were fit to a polynomial and subtracted from the raw time domain signals. After windowing with a Hamming digital filter, a fast Fourier transform algorithm was applied to obtain the frequency domain signals. The application of the digital filter improved the signal/noise ratio without any significant reduction in the resolution. The spectra shown in the figures correspond to the amplitude of the frequency domain signals.
Experimental Results
The strong anisotropy of the g-tensor allows us to conduct orientation-selective ESEEM and HYSCORE experiments, since they are performed at fixed magnetic field positions (Fig. 1 A). Consequently, information about the orientation of the interactions can be recovered from orientationally disordered samples. It is worth noting that, due to inhomogeneous broadening caused by g-strain or other mechanisms, molecules with slightly different orientations and hyperfine couplings may be resonating at any given field value. This can produce an additional broadening of the ESEEM (and HYSCORE) features that in some cases might prevent the information on the hyperfine interactions from being obtained. The orientation selectivity at every field position can be estimated from the line width of the CW-EPR and ei-EPR features. For instance, excitation width is ∼20° at 209 mT (gZ HALS position) but is quite smaller for larger field values. Nevertheless, our ESEEM and HYSCORE spectra displayed narrow signals that can be properly analyzed, indicating that the effect of inhomogeneous broadening on the line width remains small enough. It has to be considered that g-strain was reduced, especially for the HALS form, by using a mixture of water/glycerol as solvent (11).
Figure 1.

(A) 2p echo-induced EPR spectrum of Cyt c6. Positions associated with the g principal values are indicated with stars (for LS) and arrows (for HALS). The high field region is magnified. Contribution to the EPR absorption of both forms are superimposed in the field region between the two dashed lines. Positions in the HALS high field contribution where 1D ESEEM experiments were performed are indicated with solid sticks. See text for details. (B) Model of the iron-porphyrin complex in Cyt c6. The x (molecular), x′ (electronic), and X (magnetic) axes are indicated with the rotation/counterrotarion angle γ/−γ. The z ≡ z′ ≡ Z axis is perpendicular to the plane, and the y, y′, and Y axes are in the plane, perpendicular to x, x′, and X, respectively.
As shown in Fig. 1 A, the signals of both LS and HALS Cyt c6 forms are superimposed in the magnetic field region between 234 mT and 495 mT (11). Therefore, when ESEEM experiments are performed within this field region, in principle both HALS and LS forms could contribute to the spectrum. We discussed elsewhere (11) that ENDOR spectra performed in this region ought to be assigned to the LS form, and it is also valid for the ESEEM spectra. Signals detected at fields either below 234 mT or above 495 mT come only from the HALS form.
HYSCORE experiments were performed by tuning the magnetic field at the positions corresponding to the g-tensor principal values of the Cyt c6 forms (Fig. 1 A), and they were labeled gi-HYSCORE (i = X, Y, or Z) spectra. Fig. 1 B shows a scheme of the heme molecule including axes and angles definition.
Experimental results obtained for the LS and HALS forms are described separately.
LS form
HYSCORE experiments for the LS form were performed at gZ (234 mT), gY (301 mT), and gX (495 mT) field values (Fig. 1 A). Fig. 2 A displays a gZ-HYSCORE spectrum measured at 6 K (τ = 208 ns), whereas Table 1 collects the main features observed in gZ-HYSCORE spectra measured at the different τ values. The most intense correlation peaks were those labeled LZ2 and LZ3. The difference between the two frequencies of each one of these correlation peaks was about four times the Larmor frequency of 14N (0.7 MHz for this magnetic field). Consequently, the frequencies of both LZ2 and LZ3 were assigned to double quantum (dq) transitions of nitrogen nuclei bound to the iron. Previous studies showed that the most intense correlation peak in the gZ-HYSCORE spectra corresponds to the nitrogens in the heme porphyrin ring (N-Hem) (7–10). Therefore, LZ2 was associated with N-Hem, whereas LZ3 was associated with the directly coordinated nitrogen of the axial histidine residue (N-His). This assignment is supported by the combination features LZ4 and LZ5. The frequencies of LZ4 are exactly twice those of LZ2, whereas the frequencies of LZ5 coincide with the sum of the frequencies of LZ2 and LZ3. For assigning these combination features, it should be remembered that there is only one N-His nitrogen atom bound to the iron, but there are four nitrogen atoms from the pyrrole rings (N-Hem).
Figure 2.
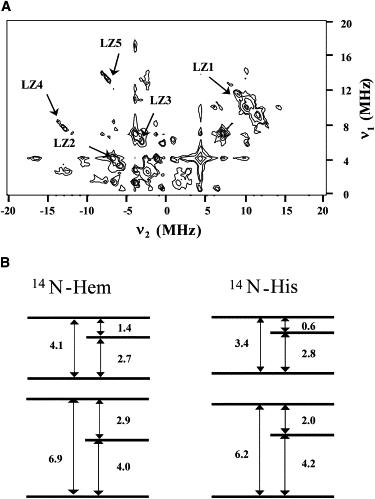
(A) gZ-HYSCORE spectrum (B = 234 mT) measured at 6 K of the LS form of Cyt c6 from Anabaena PCC 7116. The separation between the two first pulses was τ = 208 ns (for other details, see text). (B) Scheme of nuclear sublevel splitting of the pyrrolic (N-Hem) and axial (N-His) nitrogen nuclei in the LS form for a magnetic field of 234 mT directed along the Z axis. The numbers indicate the frequency (in MHz) of the corresponding transition.
Table 1.
Correlation features observed in the gZ-HYSCORE spectra of the LS form of Cyt c6
| Frequency (MHz)∗ | 14N-Hem† | 14N-His† | 1H† | Label‡ |
|---|---|---|---|---|
| Single nuclear correlation features | ||||
| 11.6, 9.0 | ++ | LZ1 | ||
| 6.9, −4.1 | ++ | LZ2 | ||
| 6.9, −2.7 | + | |||
| 6.9, −1.4 | + | |||
| 6.2, −3.4 | ++ | LZ3 | ||
| 6.2, −0.6 | + | |||
| 4.2, 0.6 | + | |||
| 4.1, −2.9 | + | |||
| 4.0, −1.4 | + | |||
| 2.9, −2.7 | + | |||
| 2.9, 1.4 | + | |||
| 2.9, −0.6 | + | + | ||
| 2.8, −2.0 | + | |||
| 2.0, −0.6 | + | |||
| Combination features | ||||
| 17.0, −4.1 | + | + | ||
| 16.4, −3.4 | + | + | ||
| 13.8, −8.2 | + | LZ4 | ||
| 13.1, −7.5 | + | + | LZ5 | |
| 12.7, −2.7 | + | + | ||
| 10.9, −4.2 | + | |||
| 8.2, −6.9 | + | |||
| 7.4, −6.3 | + | + | ||
| 4.1, −0.4 | + | + | ||
The accuracy in frequency is ±0.2 MHz.
The minus sign in the second frequency value indicates that the feature is detected in mainly the second, (+, −), quadrant of the HYSCORE frequency spectra.
Double plus signs denote signals assigned to 14N dq-dq correlations and to 1H correlations. Other correlations are indicated by single plus signs.
For some signals, a label was given to identify them in figures and text.
Additional, weaker signals were detected in both quadrants (Table 1). The signals corresponded to frequencies lower than those of the dq-dq peaks and can be assigned to correlations either between dq and single quantum (sq) transitions or sq-sq. All the spectral features can be explained with the nuclear sublevel diagrams displayed in Fig. 2 B. It is worth noting that one single set of N-Hem nuclei (together with the N-His nucleus) is enough to explain all the observed transitions. This indicates that for the orientation of the magnetic field perpendicular to the heme plane (which corresponds to the gZ axis) the four N-Hem nuclei are equivalent, as reported in other heme systems (7).
The correlation ridge LZ1 was associated with a proton interaction with an effective hyperfine constant ∼2.6 MHz. This value turns out to be larger than any of the proton interaction constants obtained from gZ-ENDOR spectra (11). A similar signal was reported in bis-histidine model compounds (7), suggesting it should be assigned to one of the protons in the histidine residue. Parameters for His protons can be calculated by estimating the proton dipolar coupling (using a point dipole approximation) and including the isotropic hyperfine constants suggested by Scholes et al. (5). These calculations confirmed that the coupling with the proton bound to C(5) of the axial histidine ligand, H(5)-His, could account for this signal. Values of ∼3.1 Å for H(5)-Fe distance and ∼41° for the angle between H(5)-Fe and gZ axes were considered, which are compatible with the molecular structure of heme centers.
The dominant features in the gY-HYSCORE spectra of the LS form (301 mT, Fig. 1 A) again corresponded to N-Hem and N-His dq-dq correlation peaks (Fig. 3). At this field position, it can be seen that the correlation features are extended ridges. This is because for this field position, molecules displaying many different orientations with regard to the field direction all contribute to the spectrum.
Figure 3.
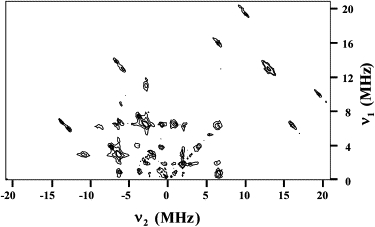
gY-HYSCORE spectrum (B = 301 mT) measured at 6 K of the LS form of Cyt c6 from Anabaena PCC 7116. Separation of the two first pulses was τ = 208 ns. (for other details, see text).
In the gX-HYSCORE spectrum of the LS form, three dq-dq correlation signals could be expected, one from the N-His nucleus and two from the two pairs of N-Hem nuclei that, in principle, are nonequivalent for this magnetic field orientation. However, only one dq-dq correlation peak, LX1, was observed (Fig. 4 A). The LX2 correlation peak, whose frequencies were just twice those of LX1, indicated that LX1 is associated with the dq-dq correlation of an N-Hem pair. It seems reasonable that the dq-dq correlation features of the other N-Hem pair coincide with this one, as it was previously observed in Cyt b559 and model compounds (7). A dq-dq correlation signal due to coupling to a N-His was not detected, although it might coincide with that of the two pairs of N-Hem nuclei. Table 2 collects all the correlation signals observed in the gX-HYSCORE spectra of the LS form of Cyt c6. Interestingly, the experimental features can be well understood by considering two pairs of nonequivalent N-Hem nuclei with similar dq frequencies in both nuclear sets but different sq frequencies. The complete nuclear sublevel schemes are shown in Fig. 4 B. The combination features (collected in the lower part of Table 2 are fully compatible with these schemes. Unfortunately, no signals that could be undoubtedly assigned to N-His were observed.
Figure 4.

(A) gX-HYSCORE spectrum (B = 495 mT) measured at 6 K of the LS form of Cyt c6 from Anabaena PCC 7116. Separation of two first pulses was τ = 208 ns (for other details, see text). (B) Scheme of nuclear sublevel splitting of two distinguishable pyrrolic (N-Hem) nitrogen nuclei for a magnetic field of 495 mT directed along the X axis. The numbers indicate the frequency (in MHz) of the corresponding transition.
Table 2.
Correlation features observed in the gX-HYSCORE spectra of the LS form of Cyt c6
| Frequency (MHz)∗ |
14N-Hem† |
||
|---|---|---|---|
| Pair 1 | Pair 2 | Label‡ | |
| Single nuclear correlation features | |||
| 7.8, −2.2 | ++ | ++ | LX1 |
| 7.8, 1.3 | + | ||
| 5.2, 2.2 | + | ||
| 5.2, 0.9 | + | ||
| 4.6, −2.2 | + | ||
| 4.6, 1.6 | + | ||
| 4.6, −0.6 | + | ||
| 3.2, −2.2 | + | ||
| 2.6, −2.2 | + | ||
| Combination features | |||
| 15.6, − 4.4 | + | + | LX2 |
| 15.6, −2.2 | + | + | |
| 13.1, −2.2 | + | ||
| 12.4, −2.2 | + | ||
| 11.0, −4.4 | + | ||
| 10.4, − 4.4 | + | ||
| 7.8, −4.4 | + | + | |
| 4.4, −3.2 | + | ||
The accuracy in frequency is ±0.2 MHz.
The minus sign in the second frequency value indicates that the feature is detected in mainly the second, (+, −), quadrant of the HYSCORE frequency spectra.
Double plus signs denote signals assigned to 14N dq-dq correlations. Other correlations are indicated by single plus signs.
For some signals, a label was given to identify them in figures and text.
HALS form
In the magnetic field region where the CW-EPR spectra of both Cyt c6 forms are superimposed, the echo intensity of the HALS form is too weak to obtain HYSCORE features associated with it (11). Setting the magnetic field out of this region allowed us to detect ESEEM signals from the HALS form. Thus, gZ (209 mT) HYSCORE spectra for the HALS form were measured. No HYSCORE spectra could be obtained at field positions above 500 mT due to the very low intensity of the echo, but a series of 1D ESEEM experiments were performed at different field positions (Fig. 1 A).
Fig. 5 A shows a gZ-HYSCORE spectrum of the HALS form, whereas Table 3 collects the detected features in the gZ-HYSCORE spectra. These features resembled those detected for LS, and, by proceeding as described above, were interpreted as corresponding to 1H, N-Hem, and N-His interactions. The proton coupling constant detected in the HALS form was slightly larger than in the LS form (3.3 MHz versus 2.6 MHz), and the nuclear levels for N-Hem and N-His (see Fig. 2 B for LS and Fig. 5 B for HALS) showed small differences between the two forms, which suggest structural modifications.
Figure 5.

(A) gZ-HYSCORE spectrum (B = 209 mT) measured at 6 K of the HALS form of Cyt c6 from Anabaena PCC 7116. Separation of the two first pulses was τ = 208 ns (for other details, see text). (B) Scheme of nuclear sublevel splitting of the pyrrolic (N-Hem) and axial (N-His) nitrogen nuclei in the HALS form for a magnetic field of 209 mT directed along the Z axis. The numbers indicate the frequency (in MHz) of the corresponding transition.
Table 3.
Correlations observed in the gZ-HYSCORE spectra of the HALS form of Cyt c6
| Frequency (MHz)∗ | 14N-Hem† | 14N-His† | 1H† | Label‡ |
|---|---|---|---|---|
| Single nuclear correlation features | ||||
| 11.0, 7.7 | ++ | HZ1 | ||
| 6.6, −4.2 | ++ | HZ2 | ||
| 5.8, −3.4 | ++ | HZ3 | ||
| 3.9, −2.8 | + | |||
| 3.9, −1.4 | + | |||
| 3.7, −3.4 | + | |||
| 3.7, −0.9 | + | |||
| 2.8, −2.7 | + | |||
| 2.8, −2.1 | + | |||
| 2.1, −0.9 | + | |||
| Combination features | ||||
| 15.2, 1.1 | + | + | HZ4 | |
| 12.8, −8.2 | + | |||
| 12.4, −7.6 | + | + | ||
| 10.5, −4.2 | + | |||
The accuracy in frequency is ±0.2 MHz.
The minus sign in the second frequency value indicates that the feature is detected in mainly the second, (+, −), quadrant of the HYSCORE frequency spectra.
Double plus signs denote signals assigned to 14N dq-dq correlations and to 1H correlations. Other correlations are indicated by single plus signs.
For some signals, a label was given to identify them in figures and text.
Additionally, a correlation signal HZ4, not observed for the LS form, was detected; its frequencies corresponded to the combination of frequencies corresponding to the 1H correlation feature HZ1 and to the 14N-Hem dq-dq correlation HZ2. As will be discussed below, this combination feature allows us to determine the sign of the N hyperfine interactions.
Fig. 6 displays the 1D ESEEM spectra measured using a 3p sequence at different magnetic field values between 600 mT and 930 mT (Fig. 1 A). A complex set of signals at frequencies below 7 MHz were observed in all cases. At higher frequencies, a well-isolated peak, between 7.5 MHz and 9.5 MHz, was detected. As the magnetic field was increased, this peak narrowed and shifted to higher frequencies. The analysis of these spectra will be centered on this peak.
Figure 6.

3p 1D ESEEM spectra measured at 6 K for different values of the magnetic field in the high field region of the EPR spectrum of the HALS form. In all cases, τ = 96 ns.
Analysis of The Spectra
The spin Hamiltonian used for analyzing nuclear interactions in cytochromes (LS heme centers) has been described in detail elsewhere (3,7,11,17,18). In the high field approximation, each nucleus can be considered separately and its contribution can be described by introducing an effective nuclear Hamiltonian, for each electronic manifold, |±〉, with
| (1) |
where is the expected value of the fictitious spin in each electronic manifold, gn is the g-factor of the nucleus having a nuclear spin I, μn is the nuclear magneton, and and represent the hyperfine and the nuclear quadrupole coupling tensors, the last one being traceless and symmetric. The quadrupole contribution has to be considered only for nuclei with I ≥ 1, such as 14N.
Under the former description, the coupling tensors should reflect simultaneously the symmetry of the unpaired electron distribution and that of the bonding between iron and the involved nucleus. The unpaired electron density is given by
| (2) |
where the axes (x′, y′, z′), named electronic axes, are obtained from the molecular axes by a rotation around the z axis of a certain angle −γ (3,7) (Fig. 1 B). The coefficients a, b, c define the unpaired electron distribution and are related with the principal g-factors through the well-known Taylor's equations (19).
Due to the symmetry of the system (7), the hyperfine and nuclear quadrupole coupling tensors for both, N-His and N-Hem, nuclei can be expressed in the principal g-tensor frame (X, Y, Z) (Fig. 1 B) as
| (3) |
In particular, the components of nuclear quadrupole tensors of both pairs of N-Hem nuclei can be written in the (X, Y, Z) frame as
| (4) |
where Qx, Qy, Qz are the principal values of (the same for all four N-Hem nuclei), and Θ is the angle between the x axes of the quadrupole and g-tensors. Therefore, values of Θ for both pairs of N-Hem nuclei should be related by Θ(1) + Θ(2) = 90° (7). With these ideas we will analyze the obtained nuclear transition frequencies for N-His and N-Hem to get information about the hyperfine and quadrupole tensors in both forms of the Cyt c6.
Nitrogen signal in the LS form
When the magnetic field is oriented along the Z axis, the expressions for the sq (ΔMI = ±1) and dq (ΔMI = ±2) nuclear transition frequencies associated with each electron spin manifold, |±〉, are (7)
| (5) |
where νn is the nuclear Larmor frequency of 14N and the other symbols have already been defined. Consequently, through these equations AZZ, Qz, and δQ = |Qx − Qy|/2 values can be estimated from the sq and dq frequencies collected in Fig. 2 B.
The following values are obtained:
whereas the uncertainty in δQ is too high to obtain a significant number. These data are close to those obtained in the case of Cyt b559 (7).
The presence of the feature LZ5, combination of LZ2 and LZ3, indicates that the sign of AZZ is the same for both N-Hem and N-His.
To analyze gX-HYSCORE spectra, we defined the axes for which the hyperfine term is diagonal in each electron spin manifold |±〉 as (X±, Y±, Z±) (see García-Rubio et al. (7) for details). From the dq-dq N-Hem correlation features and following the previously described procedure, we obtain
Then, the values of the effective quadrupolar coupling constants can be obtained by using the sq nuclear transition frequencies and by calculating them up to the first order. From the data in Fig. 4 B the following values for the two pairs of N-Hem nuclei are obtained:
The angle Θ can be obtained for each sign election under those absolute values when the principal values of the nuclear quadrupole tensor, Qx, Qy, Qz, are known.
Only one of the principal values, Qz = QZZ, is determined from our experimental data. We pointed out previously (7) that the principal direction of the quadrupolar tensor associated with the principal value with the highest absolute value, hereafter Qx, should lie in the porphyrin plane, perpendicular to the metal-nitrogen bonding direction, being its value in the range 0.8 MHz ≤ |Qx| ≤ 1.1 MHz. The other two principal directions coincide with the normal to the porphyrin plane (Qz) and with the metal-nitrogen bonding direction (Qy).
The only choice of signs compatible with AXY values constrained by 0.7 MHz < |AXY| < 2.1 MHz (see above) and fulfilling Θ(1) + Θ(2) = 90° is
This result implies that Qx should be larger than 0.87 MHz.
Then, considering values of Qx in the range 0.9 MHz < Qx < 1.1 MHz, we obtain the following values for Θ(1) and Θ(2):
The described quadrupole principal axes coincide with the molecular axes (Fig. 1 B). Therefore, the values of the Θ(i) for the two sets allow us to obtain an estimation of the γ-angle, which relates magnetic, molecular, and electronic frames. One of the Θ(i) should coincide with γ, and the other with 90° + γ (Fig. 1 B). So we estimate 0° < | γ | < 24°, indicating that the N-Fe directions in the porphyrin plane are near g-tensor principal axes. This conclusion agrees with the estimation of the g-tensor frame orientation previously obtained from two other independent experimental data: proton ENDOR (11) and NMR (20) measurements. The small value for γ also explains the narrow correlation peaks observed in the gX-HYSCORE spectrum of the LS form of Cyt c6. In the case of Cyt b559, the gX-HYSCORE spectrum displayed sq correlations with an extended shape (7), which were associated with the x and y axes, forming an angle near 45° with the X and Y principal axes of the g-tensor.
Finally, an estimation of the value of AYY for both types of nuclei can be obtained from the gY-HYSCORE spectra. The dq-dq correlation feature due to N-Hem coupling has an extended shape parallel to the second quadrant diagonal. The effective hyperfine coupling constant, App, for the different orientation contributing to this gY-signal fulfills
One of these orientations should lie in the XZ plane. Taking into account the formerly estimated values for AZZ and AXX for such an orientation, App ≈ 5.0 MHz. Then it follows that AYY = 4.4 ± 0.4 MHz for N-Hem. Although it was not possible to obtain the AXX value for the N-His nucleus, AYY was estimated to be 5.5 ± 0.4 MHz from the corresponding dq-dq correlation signal.
Table 4 summarizes the information obtained about the coupling constants of N-Hem and N-His nuclei in the LS form of Cyt c6.
Table 4.
Nuclear spin Hamiltonian parameters for N-His and N-Hem in the LS and HALS forms of Cyt c6
| N-His | N-Hem | ||
|---|---|---|---|
| LS form | |||
| AXX (MHz) | −4.7 ± 0.2 | ||
| AXY (MHz) | 0.7 < | AXY | < 2.1 | ||
| AYY (MHz) | −5.5 ± 0.4 | −4.4 ± 0.4 | |
| AZZ (MHz) | −4.7 ± 0.5 | −5.3 ± 0.5 | |
| Qmax (MHz) | 0.8 ± 0.1∗ | 0.9 < Qmax < 1.1∗ | |
| Qz (MHz) | −0.7 ± 0.1 | −0.4 ± 0.1 | |
| Θ (degrees)† | 72 < Θ(1) < 111 | −20 < Θ(2) < 24 | |
| HALS form | |||
| AXX (MHz) | −2.7 ± 1.2 | ||
| AXY (MHz) | 2.4 ± 2.4 | ||
| AYY (MHz) | −4.9 ± 1.2 | ||
| AZZ (MHz) | −4.3 ± 0.6 | −5.4 ± 0.7 ‡ | |
| −5.5 ± 0.1 § | |||
| Qmax (MHz) | 0.8 ± 0.1∗ | 0.9 < Qmax < 1.1∗ | |
| Qz (MHz) | −0.5 ± 0.1 | −0.4 ± 0.1 | |
From the bibliography (see text).
The two values correspond to the two sets of equivalent N-Hem nuclei (see text).
Obtained from gZ-HYSCORE spectra (see text).
Obtained from 1D ESEEM at high fields (see text).
Nitrogen signal in the HALS form
The application of the above described procedure to the gZ-HYSCORE data of HALS allowed us to obtain the following parameters:
Analysis of the HZ4 feature also provided interesting information. It should be remembered that the coordinates of combination peaks are the sum or the difference of nuclear frequencies within the same electron manifold. HZ4 combines HZ1, assigned to H(5)-His, and HZ2 from N-Hem. Since the main contribution of the H(5)-His hyperfine interaction is dipolar, it follows that AZZ(1H) is positive (11). Consequently, from the frequencies of HZ4, we can conclude that AZZ(N-Hem) is negative. Additionally, the feature HZ5 that combines HZ2 (from N-Hem) and HZ3 (from N-His) indicates that the sign of AZZ is the same for both nitrogen types, and therefore AZZ(N-His) is negative as well. It is worth noting that the hyperfine isotropic contribution of nitrogen nuclei in LS heme centers was predicted to be negative (5,21). Here we present experimental evidence for this assumption.
Analysis of the 3p 1D ESEEM spectra performed in the high field region of the HALS EPR spectrum will be focused on the narrow peak between 7.5 MHz and 9.5 MHz. By analogy with the LS form, it is assigned to the largest dq transition of an N-Hem nucleus.
For a given value of the magnetic field strength B, the orientations of the paramagnetic entities contributing to the ESEEM spectra can be determined, as they should accomplish
| (6) |
where θ is the colatitude and ϕ is the azimuth of the magnetic field direction referred to the g-tensor principal axes frame, and ν is the microwave frequency. Except for the extremal field positions corresponding to the gX and gZ values, molecules with different orientations contribute to the spectra measured at each B value. Besides, it should be noted that θ- and ϕ-angles will also be different for molecules with slightly different g-tensor principal values. Such molecules, as well as others with different A values, can be in the sample because of the inhomogeneous broadening (from g-strain or other processes). The effect of these would be an additional broadening of the ESEEM signals. By simulating CW-EPR and ei-EPR spectra of the HALS form, we got an estimation of the excitation width in the ESEEM experiments. For the field region between 600 mT and 930 mT, we obtained a value of 4° around the orientations calculated from Eq. 6 as the largest width that can be considered small. Moreover, the peak between 7.5 MHz and 9.5 MHz remained narrow for all the measurements. It indicates that the effect of the inhomogeneous broadening on this peak is small and can be neglected.
The frequency of the nuclear transition displaying the selected peak in the ESEEM spectra depends on the orientation of the magnetic field. For the g-value in each measurement, among all the excited molecules there is some of them oriented in such a way that the magnetic field lies on the ZX plane. For these molecules, the angle α1 that the magnetic field makes with the X axis is given by
| (7) |
Similarly, there are molecules oriented in such a way that the magnetic field lies on the XY plane, for which the angle α2 that the field makes with the X axis is
| (8) |
The frequencies of the dq nuclear transitions can be calculated to the first order for these two particular orientations (see Supplementary Material for details):
| (9) |
| (10) |
where P1, Q1, P2, Q2, and R2 are constants that depend on g- and A-tensors parameters. The corresponding α1 and α2 values are determined from the magnetic field strength value using Eqs. 7 and 8. Fig. 7, A and B, shows the values of (νdq/B)2 as a function of cos(α1) and cos(α2), respectively. By fitting Eqs. 9 and 10 to the data of Fig. 7, A and B, respectively, we obtain P1 = 562 ± 5 MHz2/T2 and Q1 = −489 ± 5 MHz2/T2, P2 = 245 ± 15 MHz2/T2, Q2 = −166 ± 10 MHz2/T2, and R2 = −14 ± 10 MHz2/T2. Dotted lines represent the evolution predicted by Eqs. 9 and 10 with these values. Experimental data display an excellent accordance with the model.
Figure 7.
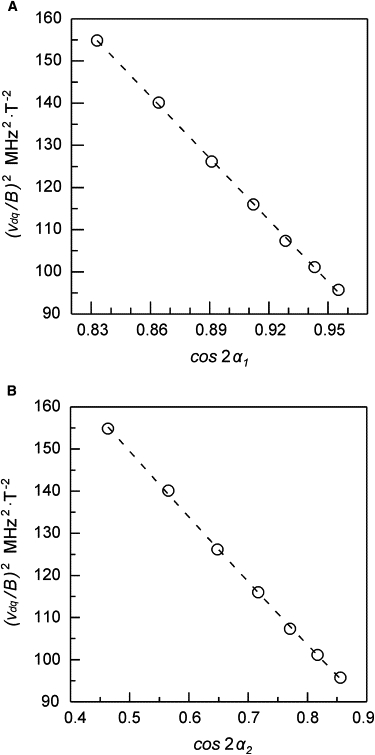
Open circles give a representation of (νdq/B)2 values as a function of cos(α1) (A) and cos(α2) (B). Dashed lines represent the fit of Eqs. 9 and 10 to the experimental data (see text for definitions and details).
From those fitting values, and following the procedure outlined in the Supplementary Material, the following hyperfine coupling parameters for N-Hem are obtained:
The result for AZZ from this analysis fits with the one obtained for N-Hem from gZ-HYSCORE measurements of the HALS form, which supports the assignment of the peak to hyperfine coupling with these nuclei. It is worth noting that the coincidence of the dq nuclear transitions for all the exited molecules, and in particular those in the two orientations that we have analyzed here, is incidental. In fact, a well-resolved, narrow peak is detected because the specific g- and A-tensor parameters of the HALS form make this dq transition nearly constant for all the excited molecules in the measuring field positions. For other spin Hamiltonian parameters the transition frequency could change for the different orientations, the spectral feature would spread out and would not be detected.
A summary of the information obtained about the coupling constant of the N-Hem and N-His nuclei in the HALS form of Cyt c6 is also given in Table 4.
Discussion
The presented ESEEM study takes advantage of the field orientation selection to retrieve information on the quadrupole and hyperfine interaction coupling tensors of the nitrogen nuclei N-Hem and N-His. These data allow us to obtain valuable information about the structure and electronic distribution of these LS heminic entities.
The γ-angle that indicates the direction of the magnetic X axis with respect to the molecular frame (Fig. 1 B) has been estimated to be between 0° and 24° for the LS form. This angle was previously determined for Cyt c6 from Anabaena PCC 7119 independently of NMR (20) and ENDOR (7) measurements. In both cases, the γ-value was near 10°, fully consistent with our findings.
Besides, the iron electronic distribution can be depicted from the g-tensor frame orientation (3,11). The unpaired electron is mainly in the zy′ plane, where the y′ axis direction makes an angle of −γ with one of the Fe-N-Hem directions (Fig. 1 B). Consequently, in Cyt c6 the semiocuppied orbital is near one of the Fe-N-Hem bonding directions. This situation differs noticeably from that of our previous HYSCORE study on Cyt b559 and a model compound, where it was found that the unpaired electron lies in a plane normal to the heme plane but almost bisects two of these bonding directions (7). This demonstrates the ability of this kind of analysis for discriminating between both situations.
The lack of N-His ESEEM signals for some orientations of the magnetic field, in particular in the gX-spectra, prevents us from obtaining information about the spatial arrangement of this axial ligand. In a previous ENDOR study (11), it was suggested that the imidazole is oriented in such a way that its projection on the heme plane is almost perpendicular to the gX axis. This could explain why the N-His coupling is not detected in the gX-HYSCORE spectra, as the X direction would be near a principal axis of the N-His hyperfine tensor and, therefore, the intensity of their HYSCORE features could be small.
In the case of the HALS form, the incomplete determination of the quadrupole tensor prevents us from obtaining the g-tensor frame orientation. This was also the case in the previously mentioned ENDOR study (11).
On the other hand, the combination of data obtained from ENDOR (11) and ESEEM studies provides detailed information on the hyperfine interactions for many nuclei within the porphyrin ring and the axial ligands of the heme center for both LS and HALS forms.
Summarizing, the following evidence has been collected:
Hyperfine interaction with N nuclei adjacent to the iron is significant.
Their isotropic and anisotropic components are comparable.
The isotropic part is negative for the HALS form. A similar sign is expected for the LS form, as well as for other LS heme systems.
Hyperfine interactions with mesoprotons, protons in the methyl substituent of the pyrrole rings, and protons in the axial ligand residues (His and Met) were detected from ENDOR measurements (11). A point dipolar model accounted for the anisotropic part, but they all displayed an isotropic contribution that should be associated with spin polarization of these atoms.
Several of our findings for the oxidized protein resulted in not being compatible with the x-ray structure of the reduced one: first, the structure showed only one form for the heme center; second, the hyperfine coupling for several protons in both axial ligands predicted from the structure turned out to be very different from the measured ones (11); and finally, the projection of the imidazole ring on the porphyrin plane displays an angle of ∼35° with an N-Fe-N direction, whereas ENDOR results for the LS form suggested that this angle must be ∼10° (11). Therefore, a remarkable structural change in the oxidation process can be inferred.
The three main differences between the two forms detected in our studies are first, a different orbital for the unpaired electron, the HALS form showing a larger admixture of dx′z and dxy with the dy′z main orbital (11); second, differences in the hyperfine interaction with N-Hem, with a smaller isotropic part and a higher anisotropic part for the HALS form as compared with the LS one; and third, a value for |Qz| of N-His nucleus larger in the LS form than in the HALS one.
The presence of anisotropic hyperfine interaction with N nuclei is not a proof of spin polarization, as it could come from dipolar interaction with the spin density in the iron. However, there is no doubt that polarization of the s-orbitals occurs for all the nuclei with isotropic hyperfine interaction.
We can discuss the origin of the spin density on the porphyrin ring and the axial ligands. The standard models for analyzing NMR data on hyperfine couplings in LS heme systems suppose that the semioccupied iron orbital forms molecular orbitals with π-orbitals of the ligands, and ∼20% of the spin density is out of the iron orbital (22). This would explain the spin densities in protons of the axial ligands and porphyrin ring obtained from NMR measurements. On the other hand, this model contrasts with the fact that many EPR spectra of LS heme systems are properly interpreted by using a model where the deviation of the “reduction factor” K (which is a measure of the presence of the electron out of the iron orbital) from 1 is small or even negligible (2,3). Furthermore, proton anisotropic hyperfine coupling parameters are correctly obtained from “point dipole interaction” calculations where the electron spin is supposed to be at the iron position, without using any reduction factor, additionally pointing out that the unpaired electron is very localized. Magliozzo and Peisach (21,23) have argued that a negative isotropic contribution for the N-Hem hyperfine coupling, as the one found in our work, should be mainly due to a direct spin polarization of s-orbitals of nitrogen atoms, whereas the existence of unpaired electron density in a π-orbital would contribute positively to it. So, direct polarization would dominate in the detected N hyperfine coupling.
In a recent study, Johansson et al. (24) pointed out an alternative model from density functional theory (DFT) calculations that would account for all the experimental evidence. According to their calculations, the spin density would appear in the ligands mainly via spin polarization of the orbitals involved in the σ N-Fe bonding. The total spin density in the semioccupied d iron orbital would correspond to one electron, but this density would cause strong spin polarization of the rest of the iron orbitals. This idea is well supported by the fact that iron s-orbitals are indeed strongly polarized and display a large hyperfine interaction, detected from Mössbauer measurements (3). The polarization would also involve electrons in the iron orbitals implicated in the coordinate bond of the heme complex that come from the lone pair orbitals of N-Hem and N-His. Thus, these N 2sp2 bonding orbitals would show a large, negative, spin density. From these calculations, the rest of the spin density in the molecule would also be explained, including some spin density that propagates to the conjugated π-orbitals of the porphyrin and imidazole rings. According to this model, iron-porphyrin and iron-imidazole π-bondings, if occurring, would be substantially weaker than previously considered, as the widely used semiempirical calculation methods are not accurate for the interpretation of experimental data in these systems (24).
A key point of this model is that spin polarization places spin density out of the iron orbitals without delocalization of the unpaired electron. It predicts nearly one electron spin in the dy′z iron orbital, as detected by CW-EPR, negative isotropic hyperfine contribution for N-Hem and N-His, as suggested by this and other studies (5,7–10,21,23), and spin polarization in the heme environment, as detected by NMR, ENDOR, and ESEEM. Experimental determination of hyperfine tensors' frame orientations in heme systems would be useful for additionally supporting this model.
It should be noted that both models are not radically different: the former one neglected the importance of the σ-polarization and overvalued that of the π-bonding, but in both cases π-spin density is responsible for the detected hyperfine coupling of many nuclei throughout the heme center. Nevertheless, these differences could be relevant from a mechanistic point of view.
As a final point we want to pay attention to the coexistence of the two different EPR forms, LS and HALS, in Cyt c6. Our experiments have shown that both forms display different electronic distribution within the iron orbitals, both without any appreciable spin electron delocalization (11). The change in the electronic distribution could slightly affect the N-Fe bonding in the complex, accounting for the detected differences. However, it is worth noting that the hyperfine couplings in both forms are rather similar, indicating that, although the spin polarization process can be affected by the actual electronic distribution of the iron, it takes place in a similar way for both forms.
We pointed out in the Introduction that such a coexistence often takes place in cytochromes and other hemeproteins (12–16). It is well established that the difference between LS (type II) and HALS (type I) heme systems is mainly due to the relative orientation of the axial ligands (2,3). In bis-imidazole heme centers, the LS form corresponds to nearly parallel imidazole rings, whereas the HALS form displays nearly perpendicular imidazole rings. In His-Met hemeproteins such as Cyt c6, the actual form of the heme center has to be controlled by the orientation of the axial ligands as well, although the influence of each residue could be different. For some cytochromes c where coexistence of two forms was revealed from EPR measurements, NMR studies suggested that a change in the conformation of Met ligand would cause switching from one EPR form to another (25,26). The process may be similar in our case, although we have no data supporting this hypothesis.
On the other hand, larger orientational changes between the two forms cannot be rejected. As we indicated, it should be taken into account that a noticeable change in the axial ligands conformation seems to take place in the oxidation process. Even if differences in the axial ligand orientations between both EPR forms were modest, the switching between them would have additional structural consequences, as the conformation of the porphyrin ring should also change, from planar (LS) to ruffled (HALS) (2,6). It is worth noting that previous calculations of model heme complexes showed that the orientation of the axial ligands does not appreciably change the energy of the system (27). As the axial ligands are chain residues in hemeproteins, their precise orientations with regard to the heme cofactor are controlled by the protein structure. The conformational changes between the two coexisting oxidized forms could influence the formation of the reaction complexes or the mechanisms of electron exchange. In this context, it is worth remembering that Cyt c6, as a charge carrier, accomplishes two reactions with different complexes: oxidation of cytochrome b6f and reduction of photosystem I.
Conclusion
An ESEEM study of the two EPR coexisting forms of Cyt c6 was performed. HYSCORE experiments provided information on the hyperfine couplings of the nitrogens bound to the iron, including the sign of the isotropic coupling parameters. For the HALS form, additional information was obtained from 1D ESEEM measurements. The combination of these experiments with data from CW-EPR and ENDOR provided valuable data on the electronic structure of both forms. Our results support a spin distribution model for LS heme systems based on an unpaired electron very localized in an iron d orbital and a main way of polarization of the porphyrin and axial ligands via σ iron-nitrogen bonds. The functional relevance of the coexistence of these two forms, often observed in c-type cytochromes, was discussed on the basis of the experimental evidence.
Supplementary Material
Background, application of data, and one table are available at www.biophys.org/biophysj/supplemental/S0006-3495(08)00002-7.
Supplementary Material
Dq Transition of N-Hem of the Hals Form
Acknowledgments
This work was supported by Diputación General de Aragón (Grant PM062/2007 to M.M.) and by Comisión Interministerial de Ciencia y Tecnología (CICYT, Grants BQU2001-2520 and BIO2007-65890-C02-01 to M.M. and BFU2005-07422-C02-02 to P.J.A.).
Footnotes
Inés García-Rubio's present address is Laboratory of Physical Chemistry, ETH Hönggerberg, CH-8093 Zurich, Switzerland.
References
- 1.Moore G.R., Pettigrew G.W. Springer; Berlin: 1990. Cytochrome c. Evolutionary, Structural and Physicochemical Aspects. [Google Scholar]
- 2.Walker F.A. Magnetic spectroscopic (EPR, ESEEM, Mössbauer, MCD and NMR) studies of low-spin ferriheme centers and their corresponding heme proteins. Coord. Chem. Rev. 1999;185–186:471–534. [Google Scholar]
- 3.Alonso P.J., Martínez J.I., García-Rubio I. The study of the ground state Kramers doublet of low-spin heminic system revisited: a comprehensive description of the EPR and Mössbauer spectra. Coord. Chem. Rev. 2007;251:12–24. [Google Scholar]
- 4.Scholes C.P., Van Camp H.L. ENDOR from nitrogens and protons in low spin ferric heme and hemoproteins. Biochim. Biophys. Acta. 1976;434:290–296. doi: 10.1016/0005-2795(76)90061-1. [DOI] [PubMed] [Google Scholar]
- 5.Scholes C.P., Falkowski K.M., Chen S., Bank J. Electron nuclear double resonance (ENDOR) of bis(imidazole)-ligated low-spin ferric heme systems. J. Am. Chem. Soc. 1986;108:1660–1671. [Google Scholar]
- 6.Walker F.A. Pulsed EPR and NMR spectroscopy of paramagnetic iron porphyrinates and related iron macrocycles: how to understand patterns of spin delocalization and recognize macrocycle radicals. Inorg. Chem. 2003;42:4526–4544. doi: 10.1021/ic026245p. [DOI] [PubMed] [Google Scholar]
- 7.García-Rubio I., Martínez J.I., Picorel R., Yruela I., Alonso P.J. HYSCORE spectroscopy in the cytochrome b559 of the photosystem II reaction center. J. Am. Chem. Soc. 2003;125:15846–15854. doi: 10.1021/ja035364g. [DOI] [PubMed] [Google Scholar]
- 8.Vinck E., Van Doorslaer S. Analysing low-spin ferric complexes using pulse EPR techniques: a structure determination of bis (4-methylimidazole) (tetraphenylporphyrinato) iron(III) Phys. Chem. Chem. Phys. 2004;6:5324–5330. [Google Scholar]
- 9.Ioanitescu A.I., Dewilde S., Kiger L., Marden M.C., Moens L. Characterization of nonsymbiotic tomato hemoglobin. Biophys. J. 2005;89:2628–2639. doi: 10.1529/biophysj.105.060582. [DOI] [PMC free article] [PubMed] [Google Scholar]
- 10.Vinck E., Van Doorslaer S., Dewilde S., Mitrikas G. Analyzing heme proteins using EPR techniques: the heme-pocket structure of ferric mouse neuroglobin. J. Biol. Inorg. Chem. 2006;11:467–475. doi: 10.1007/s00775-006-0100-2. [DOI] [PubMed] [Google Scholar]
- 11.García-Rubio I., Medina M., Cammack R., Alonso P.J., Martínez J.I. CW-PR and ENDOR study of cytochrome c6 from Anabaena PCC 7119. Biophys. J. 2006;91:2250–2263. doi: 10.1529/biophysj.105.080358. [DOI] [PMC free article] [PubMed] [Google Scholar]
- 12.Brautigan D.L., Feinberg B.A., Hoffman B.M., Margoliash E., Peisach J. Multiple low spin forms of the cytochrome c ferrihemochrome. J. Biol. Chem. 1977;252:574–582. [PubMed] [Google Scholar]
- 13.Gadsby P.M.A., Peterson J., Foote N., Greenwood C., Thomson A.J. Identification of the ligand-exchange process in the alkaline transition of horse heart cytochrome c. Biochem. J. 1987;246:43–54. doi: 10.1042/bj2460043. [DOI] [PMC free article] [PubMed] [Google Scholar]
- 14.Simpkin D., Palmer G., Devlin F.J., McKenna M.C., Jensen G.M. The axial ligands of heme in cytochromes: a near-infrared magnetic circular dichroism study of yeast cytochromes c, c1, and b and spinach cytochrome f. Biochemistry. 1989;28:8033–8039. doi: 10.1021/bi00446a010. [DOI] [PubMed] [Google Scholar]
- 15.Campos A.P., Aguiar A.P., Hervás M., Regalla M., Navarro J.A. Cytochrome c6 from Monoraphidium braunii. A cytochrome with an unusual heme axial coordination. Eur. J. Biochem. 1993;216:329–341. doi: 10.1111/j.1432-1033.1993.tb18150.x. [DOI] [PubMed] [Google Scholar]
- 16.Inda L.A., Medina M., Saraiva L.M., Gómez-Moreno C. Characterisation of cytochrome c6 from Chlorella fusca. Photosynth. Res. 1997;54:107–114. [Google Scholar]
- 17.Abragam A., Bleaney B. Clarendon Press; Oxford: 1970. Electron Paramagnetic Resonance of Transition Ions. Ch 15. [Google Scholar]
- 18.Spaeth J.M., Niklas J.R., Bartram R.H. Springer; Berlin: 1992. Structural Analysis of Point Defects in Solids. An Introduction to Multiple Resonance Spectroscopy. Ch 6. [Google Scholar]
- 19.Taylor C.P.S. The EPR of low spin heme complexes. Relation of the t2g hole model to the directional properties of the g tensor, and a new method for calculating the ligand field parameters. Biochim. Biophys. Acta. 1977;491:137–149. doi: 10.1016/0005-2795(77)90049-6. [DOI] [PubMed] [Google Scholar]
- 20.Louro R.O., Medina M., Aguiar A.P., Hervás M., De la Rosa M. Structural and magnetic characterisation of the haem core of ferricytochromes c6. J. Biol. Inorg. Chem. 1998;3:68–73. [Google Scholar]
- 21.Magliozzo R.S., Peisach J. Evaluation of nitrogen hyperfine and quadrupole coupling parameters for the proximal imidazole in myoglobin-azide, -cyanide, and -mercaptoethanol complexes by electron spin echo envelope modulation spectroscopy. Biochemistry. 1993;32:8446–8456. doi: 10.1021/bi00084a009. [DOI] [PubMed] [Google Scholar]
- 22.Horrocks W.D., Greenberg E.S. Evaluation of dipolar nuclear magnetic-resonance shifts in low-spin hemin system: ferricytochrome c and metmyoglobin cyanide. Biochim. Biophys. Acta. 1973;322:38–44. doi: 10.1016/0005-2795(73)90172-4. [DOI] [PubMed] [Google Scholar]
- 23.Magliozzo R.S., Peisach J. Electron spin echo envelope modulation spectroscopic study of iron-nitrogen interactions in myoglobin hydroxide and Fe(III) tetraphenylporphyrin models. Biochemistry. 1992;31:189–199. doi: 10.1021/bi00116a028. [DOI] [PubMed] [Google Scholar]
- 24.Johansson M.P., Sundholm D., Gerfen G., Wikström M. The spin distribution in low-spin iron porphyrins. J. Am. Chem. Soc. 2002;124:11771–11780. doi: 10.1021/ja026523j. [DOI] [PubMed] [Google Scholar]
- 25.Senn H., Keller R.M., Wüthrich K. Different chirality of the axial methionine in homologous cytochrome c determined by 1H NMR and CD spectroscopy. Biochem. Biophys. Res. Commun. 1980;92:1362–1369. doi: 10.1016/0006-291x(80)90436-2. [DOI] [PubMed] [Google Scholar]
- 26.Turner D.L. Determination of the haem electronic structure in His-Met cytochromes c by 13C-NMR. Eur. J. Biochem. 1995;227:829–837. doi: 10.1111/j.1432-1033.1995.tb20208.x. [DOI] [PubMed] [Google Scholar]
- 27.Medaković V., Zarić S.D. Theoretical study on orientations of axially coordinated imidazoles in model systems of cytochromes. Inorg. Chim. Acta. 2003;349:1–5. doi: 10.1016/j.jinorgbio.2005.10.010. [DOI] [PubMed] [Google Scholar]
Associated Data
This section collects any data citations, data availability statements, or supplementary materials included in this article.
Supplementary Materials
Dq Transition of N-Hem of the Hals Form