
Figure 3.
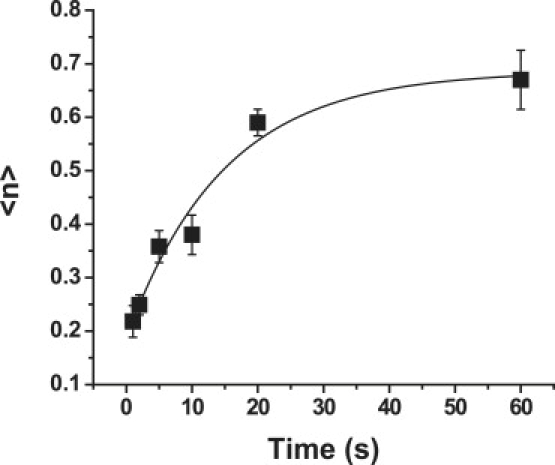
Time-dependent behavior of the system when the ligand concentration of the substrate is very large. The solid curve shows the least-squares regression of Eq. 13 for all data obtained for beads with VCAM concentration >200 sites/μm2. Error bars represent the mean ± standard error. (Note: Mean ± SE was calculated for the primary experimental measurement (Padh) then the range (Padh ± (mean ± SE)) was converted to 〈n〉 via Eq. 2. The resulting range for 〈n〉 was asymmetric, but in the figures the mean of the plus and minus errors is shown.) Each point represents between 35 and 60 cell-bead pairs, except for the 2 s and 20 s points for which there were over 140 cell-bead pairs. Values of the fitted coefficients are given in the text.