
Figure 5.
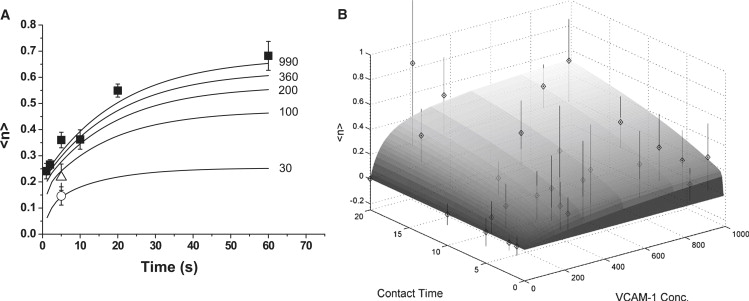
(A) Expected bond number 〈n〉 as a function of contact time at different VCAM-1 concentrations. Solid symbols are the data shown in Fig. 3, averaged for all VCAM concentrations >200 sites/μm2. Open triangle is the 5 s contact data for [VCAM-1] = 100 sites/μm2, and the open circle is the 5 s time point for [VCAM-1] = 30 sites/μm2. Curves were generated by numerical integration of Eqs. 8 and 9. The VCAM-1 concentrations used to generate the curves are given to the right of each curve (in sites/μm2). Parameter values were fixed at the values obtained in Figs. 3 and 4. (B) Three-dimensional view of the model prediction of 〈n〉 as a function of contact time (in seconds) and VCAM-1 concentration (in sites/μm2). Individual data points for all different concentrations and contact times tested are shown as diamonds. Note that lighter gray symbols fall below the surface as viewed. Error bars represent standard deviations.