
Figure 2.
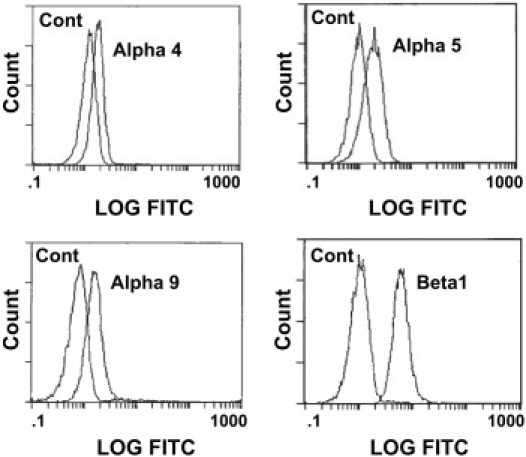
Immunofluorescent analysis of VCAM-1 receptor molecules expressed on human neutrophils. Cells were labeled for (top left) α4 (using anti-CD49d antibody P1H4); (top right) α5 (using anti-CD49e antibody SAM-1); (bottom left) α9 (using anti-α9β1 antibody Y9A2); (bottom right) β1 (using anti-CD29 antibody B-D15) and their corresponding isotype controls.