
Figure 2.
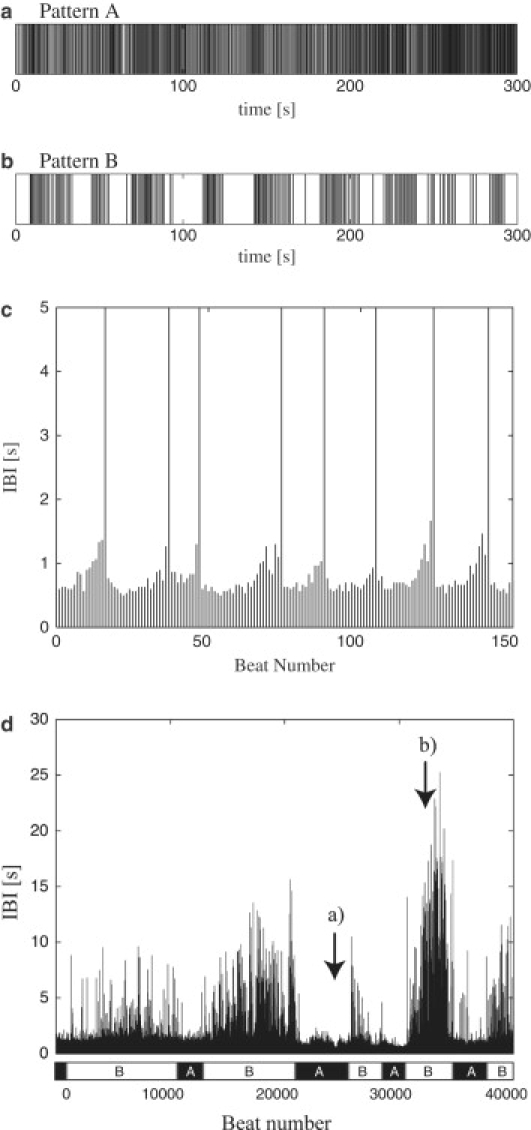
Typical temporal patterns in the spontaneous contractions of single cardiac cells. (a) Raster plot of a segment of pattern A: beats occur with relatively regular timings. (b) Raster plot of a segment of pattern B: an intermittent burst pattern. Bursts, each involving several tens of beats, are separated by quiescent periods of several tens of seconds. (c) The time series of the interbeat intervals (IBIs) in pattern B. Vertical lines are drawn to emphasize very long IBIs (quiescent periods); the eight long vertical lines in the figure correspond to quiescent periods, which are longer than 5 s. The IBIs become gradually longer in advance of the occurrence of a quiescent period (type I burst). (d) An example of spontaneous transitions between patterns. The time series of IBIs are displayed for an extended duration. On the bottom of the plot, the annotations of the patterns associated with each part of the IBI time series are represented. The raster plots presented in panels a and b were constructed from the portion of the time series marked by arrows.