
Figure 3.
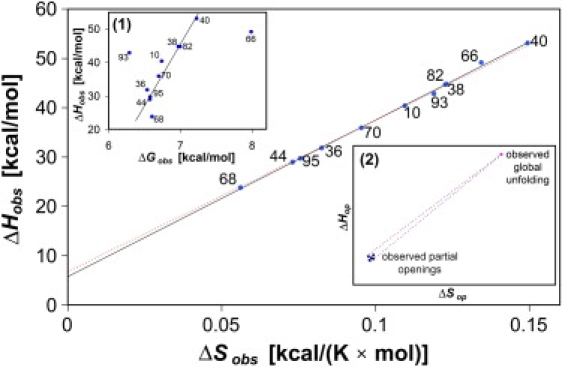
Plot of the observed enthalpy of opening against the observed entropy of opening; (solid line) linear fit of experimental values; (dashed line) expected random linear fit. (Inset 1) Plot of the observed enthalpy of opening against the observed free energy of opening at 307 K; (solid line) linear fit of experimental values, except outlier data of Val-93 and Tyr-66, with a Pearson product-moment correlation coefficient of 0.94 and a Spearman rank order correlation of 0.83. The slope of the solid line is significantly different from the random value of 1 (P = 2.3 × 10⁻⁴, according to Student's t-test) (33). (Inset 2) Hypothetical distribution of enthalpy and entropy values for different kinds of opening reactions.