
Figure 6.
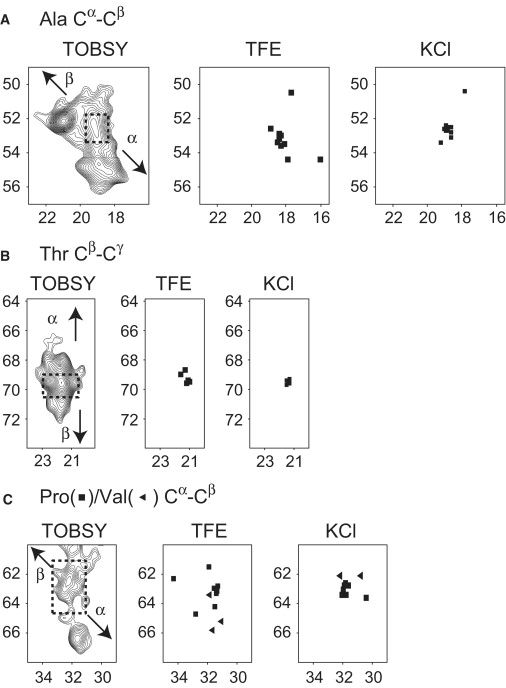
Formation of the secondary structure in rmMBP bound to actin and comparisons with the 2D plots constructed using chemical shift assignments of rmMBP dissolved in 30% TFE (37) (BMRB accession number 6100) and in aqueous 100 mM KCl solution (55) (BMRB accession number 15131). (A) The Ala Cα-Cβ region extracted from the TOBSY spectrum shown in Fig. 5D. (B) The Thr Cβ-Cγ region. (C) The Pro/Val Cα-Cβ region. The dashed squares indicate random coil regions, and the arrows indicate expected trends for crosspeaks due to α-helices and β-strands (60).