
Figure 6.
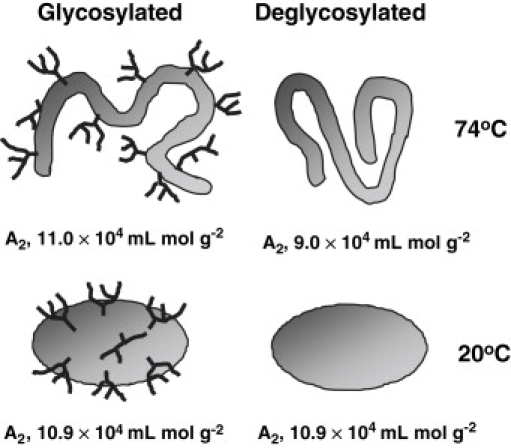
Schematic representation of the structure of Phy (left) and dgPhy (right) at 20°C (bottom) and 74°C (top). The measured A2-values are listed underneath each figure. Note that the glycans are located along the longest axis of Phy and that Phy is more expanded than dgPhy at high temperatures.