. 2009 Apr-Jun;25(2):190–194. doi: 10.4103/0970-1591.52911
© Indian Journal of Urology
This is an open-access article distributed under the terms of the Creative Commons Attribution-Noncommercial-Share Alike 3.0 Unported, which permits unrestricted use, distribution, and reproduction in any medium, provided the original work is properly cited.
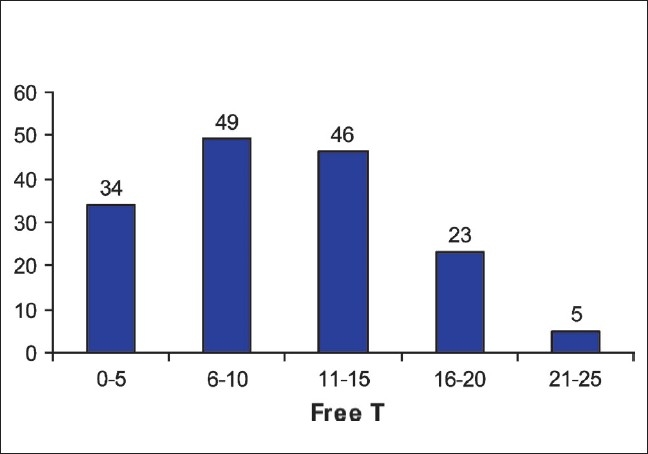
Figure 2.

Bar diagram of serum free testosterone
