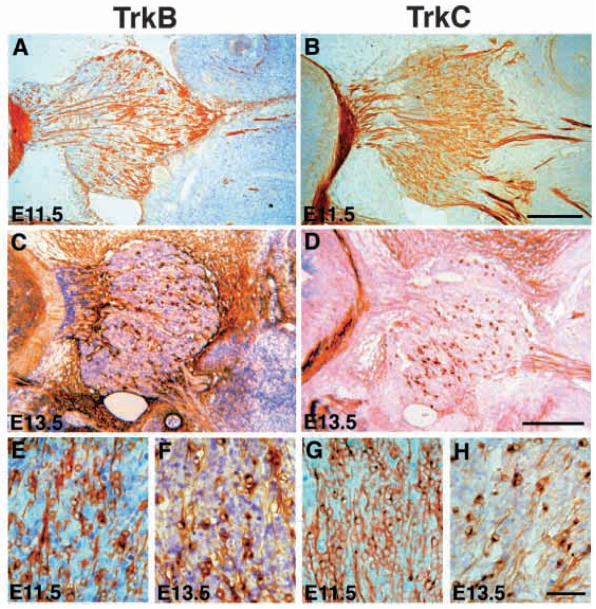
Fig. 3.
Dynamic changes in the expression patterns of TrkB- and TrkC-expressing neurons between E11.5-E13.5. (A) TrkB-expressing neurons in E11.5 trigeminal ganglion appear to cluster toward the anterior of the ganglion (to the right in this image). (B) TrkC-expressing neurons in E11.5 trigeminal ganglion are distributed throughout the entire ganglion. (C) In E13.5 trigeminal ganglion, RTB recognizes a smaller proportion of neurons, vascular structures, and the surrounding mesenchyme. (D) Similar to RTB, RTC recognizes only a small fraction of neurons at E13.5. (E–H) High magnification of TrkB at E11.5 (E) and E13.5 (F); TrkC at E11.5 (G) and E13.5 (H). Scale bars: (A–D) 200 μm; (E–H) 50 μm.

