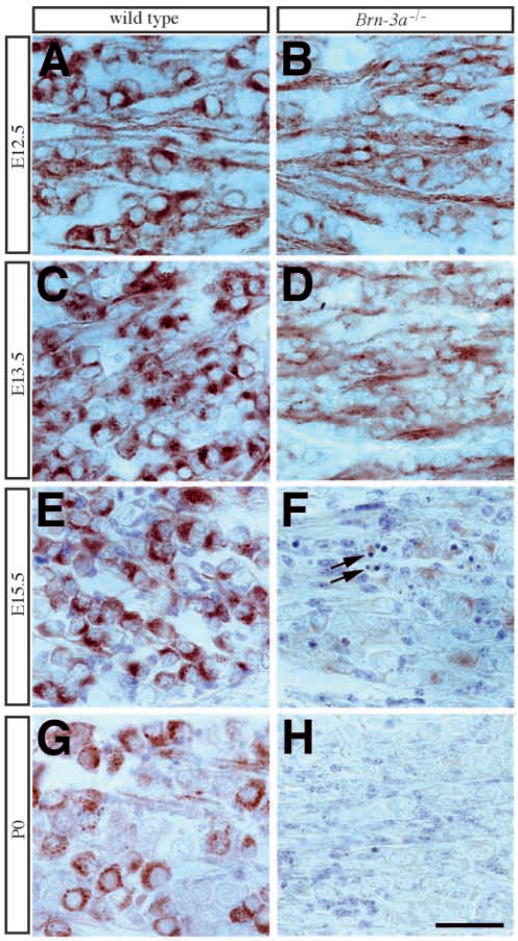
Fig. 7.
Progressive loss of TrkA expression in mutant ganglia. (A,B) In contrast to the intense TrkA expression in wild-type ganglia from E12.5 to P0, neurons in mutant ganglia show a slight reduction in TrkA staining intensity beginning at E12.5 (B). In E13.5 (C,D) mutant ganglia (D), TrkA staining in most neurons is weaker than that in the previous stage, and by E15.5 (E,F) in the mutant ganglia (F) there are very few neurons expressing TrkA. (G,H) At E17.5, the remaining neurons in mutant ganglia show no evidence of TrkA immunoreactivity. Scale bar, 50 μm.

