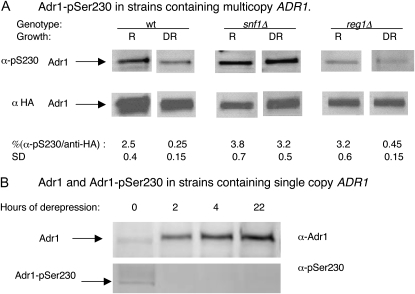
Figure 2.—
Phosphorylation of Adr1-pSer230 is glucose and Snf1 regulated. Preparation of cell extracts, electrophoresis, and Western blotting were carried out as described in materials and methods. (A) Multicopy ADR1 strains. Wild type (wt) is NKY85; snf1Δ is NKY91, and reg1Δ is NKY87; R, repressing growth conditions, 5% glucose; derepression (DR) was for 6 hr in 0.05% glucose–2% ethanol. Cell extract (25 μg) was analyzed. The signal intensity was measured as described in materials and methods for several biological replicates. The values shown are the means ± one standard deviation (SD). (B) A single copy ADR1 strain (TYY201) was analyzed in a similar manner using 100 μg of protein extracted from repressed cells (0 hr derepression) and from cells derepressed for 2, 4, and 22 hr in 0.05% glucose–2% ethanol.

