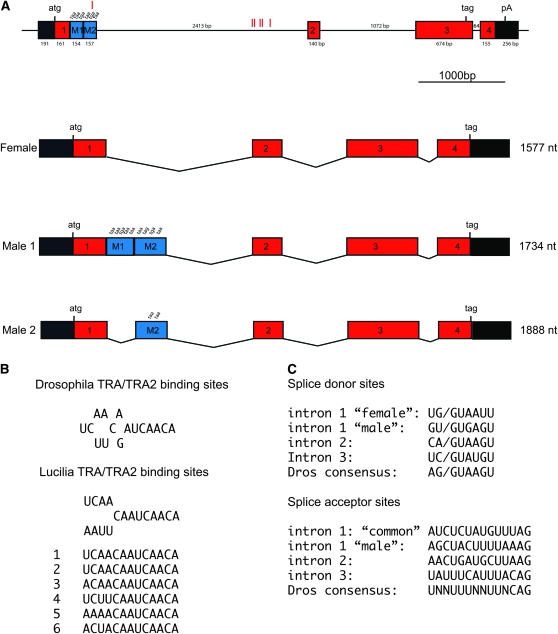
Figure 1.—
Schematic drawing of the genomic organization and the structure of the sex-specific splice variants of Lctra. (A) The top diagram represents the genomic DNA comprising the Lctra locus (to scale). The position of the exons is shown as square boxes, with exons 1, 2, 3, and 4 in red representing common exons to both female and male mRNAs. Exons M1 and M2 in blue represent male specific exons. Introns are represented by solid lines and the 5′- and 3′-untranslated regions are represented by black boxes. Exon and intron sizes are indicated and the translational start and stop sites are marked, but for clarity not all stop sites are shown. The position of putative TRA/TRA2 binding sites within the M2 exon and the first intron is represented by red vertical lines. The splicing patterns of the male and females transcripts are shown below the gene organization diagram (introns are not to scale). (B) Sequence of the six TRA/TRA2 binding sites found in the Lctra genomic DNA sequence and comparison with the D. melanogaster and L. cuprina consensus. (C) Splice donor and acceptor sites for all Lctra introns. The intron 1 “female” donor site is used to make both the female and male 2 transcripts whereas the intron 1 “male” donor site is used only in males. The intron 1 “male” acceptor site is used only to produce the minor male 2 transcript. Both sexes use the intron 1 “common” acceptor site to produce the major transcripts.

