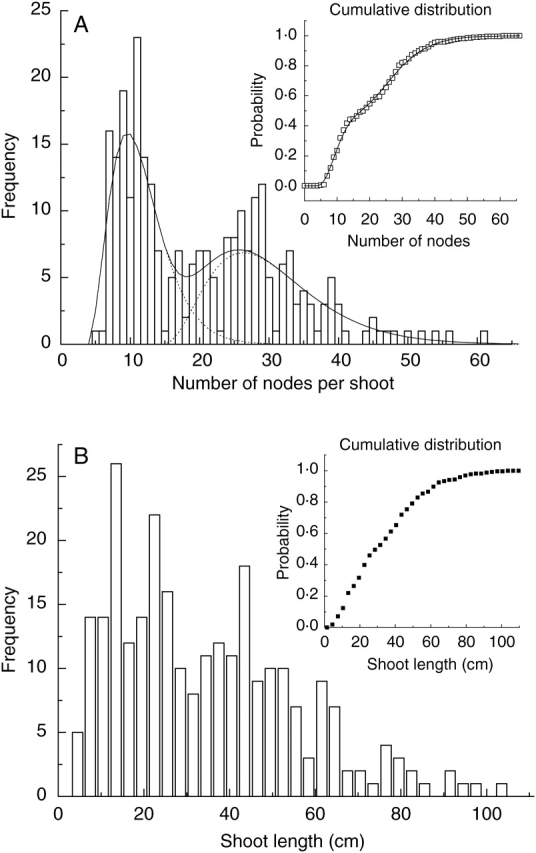
Fig. 4.

Node number (A) and shoot length (B) distributions for second-year vegetative axillary annual shoots of ‘Royal Gala’ in the treatment with MM.106 rootstock. Inserted graphs show the corresponding cumulative distribution functions. Vertical bars and symbols represent data. Dashed lines represent negative binomial distributions fitted to the data for monocyclic (mean = 11·5, SD = 4·0) and bicyclic (mean = 29·0, SD = 8·2) annual shoots. Continuous lines represent the mixture of these distributions (A, main graph) and the corresponding model for the cumulative distribution functions (A, insert graph).
