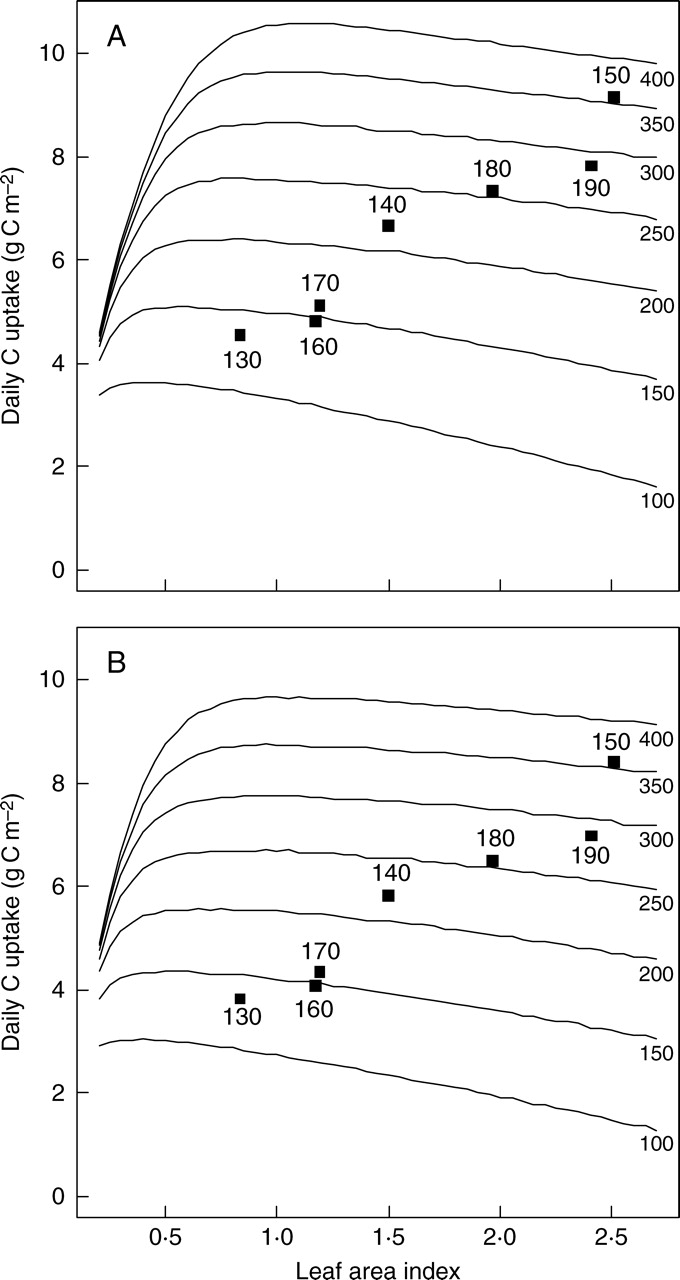
Fig. 5.

Daily estimates of GPP (in g C m−2 ground d−1) for (A) sunny and (B) overcast conditions in mid-July as a function of LAI. Simulations were run for a range of canopy nitrogen contents, Ntot (in mmol N m−2 ground), represented by the lines. The black squares correspond to the GPP estimates obtained with the LAI–Ntot combinations of the seven alpine plant communities studied. Numbers above the squares as in Fig. 3.
