Fig. 2.

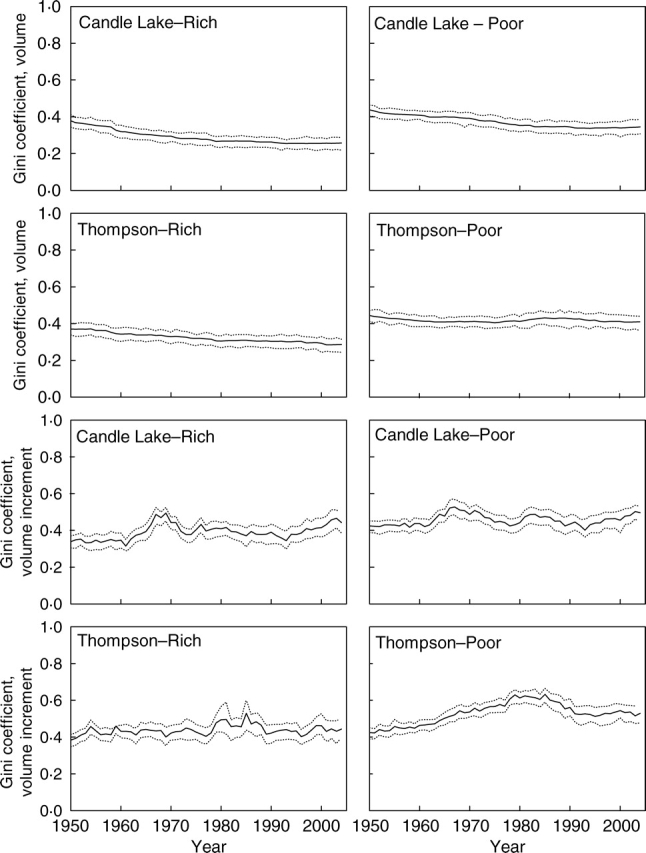
Annual trajectories of the Gini coefficient for size and size increment since 1950 at each study plot. The solid line represents the Gini coefficient, and the dotted lines are 95 % confidence intervals calculated from 1000 bootstrap samples.

Annual trajectories of the Gini coefficient for size and size increment since 1950 at each study plot. The solid line represents the Gini coefficient, and the dotted lines are 95 % confidence intervals calculated from 1000 bootstrap samples.