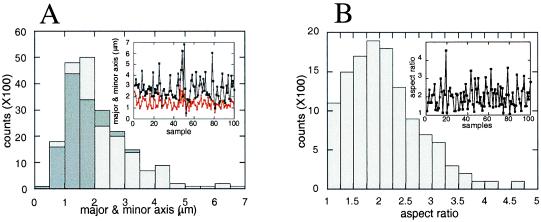
Figure 3.
Ensemble-based distribution of shape anisotropy of individual polymers. (A) Distribution of the lengths of the major (dark shading) and minor (light shading) axes for a large ensemble of flexible polymers. (Inset) Randomly sampled lengths of major (upper curve) and minor (lower curve) axes. (B) Distribution of the aspect ratio for a large ensemble of flexible polymers; <r> = <lmajor/lminor> = 2.2 ± 0.75. (Inset) Randomly sampled aspect ratio.

