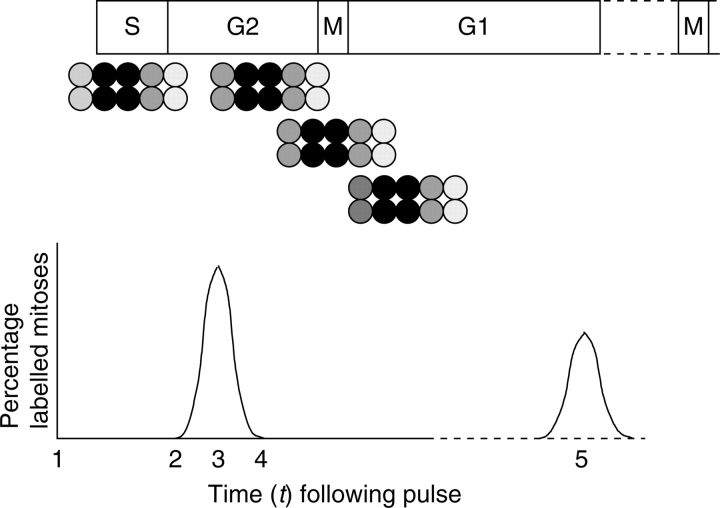
Fig. 1.
Idealised population of cells. At time t1, the cells are exposed to and incorporate [methyl-3H] thymidine (for 1 h) and are then pulse-chased with cold (non-radioactive) thymidine. Note that the cells at either end of the cluster will be lightly labelled as they move out of, or into, S-phase during the course of the pulse label. The most heavily labelled cells (e.g. in a 5-h S-phase) will be those that were in early-to-mid- S-phase during the pulse. The PLM (percentage of labelled mitoses) curve rises as the leading cells of the cluster arrive at mitosis (t2), peaks when the bulk of labelled cells are in mitosis (t3) and begins to fall as the final labelled cells exit mitosis (t4). A second peak (t5) would occur when the labelled cohort arrive at the next mitosis.

