
Fig. 2.
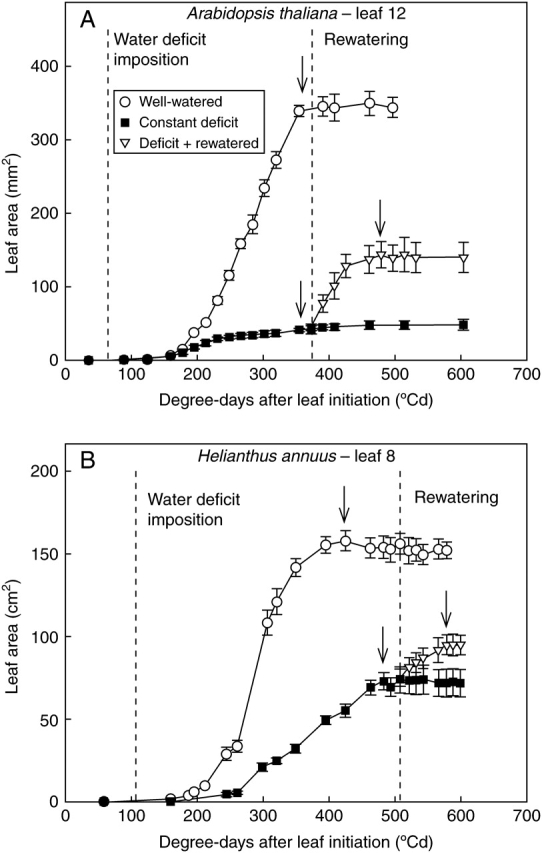
Response of leaf area to water deficit and rewatering: growth of leaf 12 of Arabidopsis thaliana (A) or leaf 8 of Helianthus annuus (B), under well-watered conditions, constant water deficit, or a water deficit followed by a rewatering after the studied leaf had ceased to expand. Leaf area is plotted against growing degree days after the initiation of each leaf. Arrows indicate the date when the leaf was considered fully expanded in each treatment. Note the difference in area units between (A) and (B). Vertical bars represent ± s.e. (n = 6).