
Fig. 6.
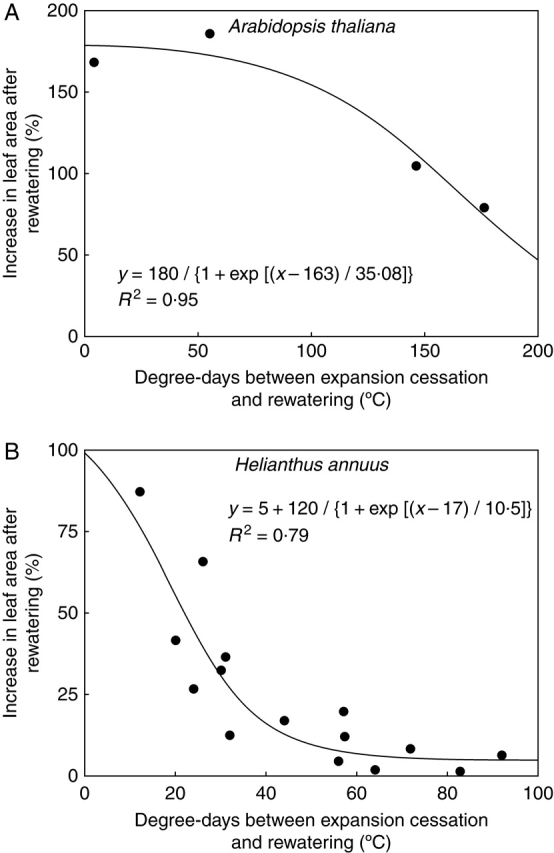
Response window of leaf area to rewatering: percentage increase in final leaf area of the rewatered treatments, relative to the final leaf area in the corresponding water-deficit treatment, in Arabidopsis thaliana (A) or Helianthus annuus (B). Data are plotted against the moment of rewatering, relative to the moment of cessation of leaf expansion in the water-deficit treatment. Data include all the experiments and treatments described.