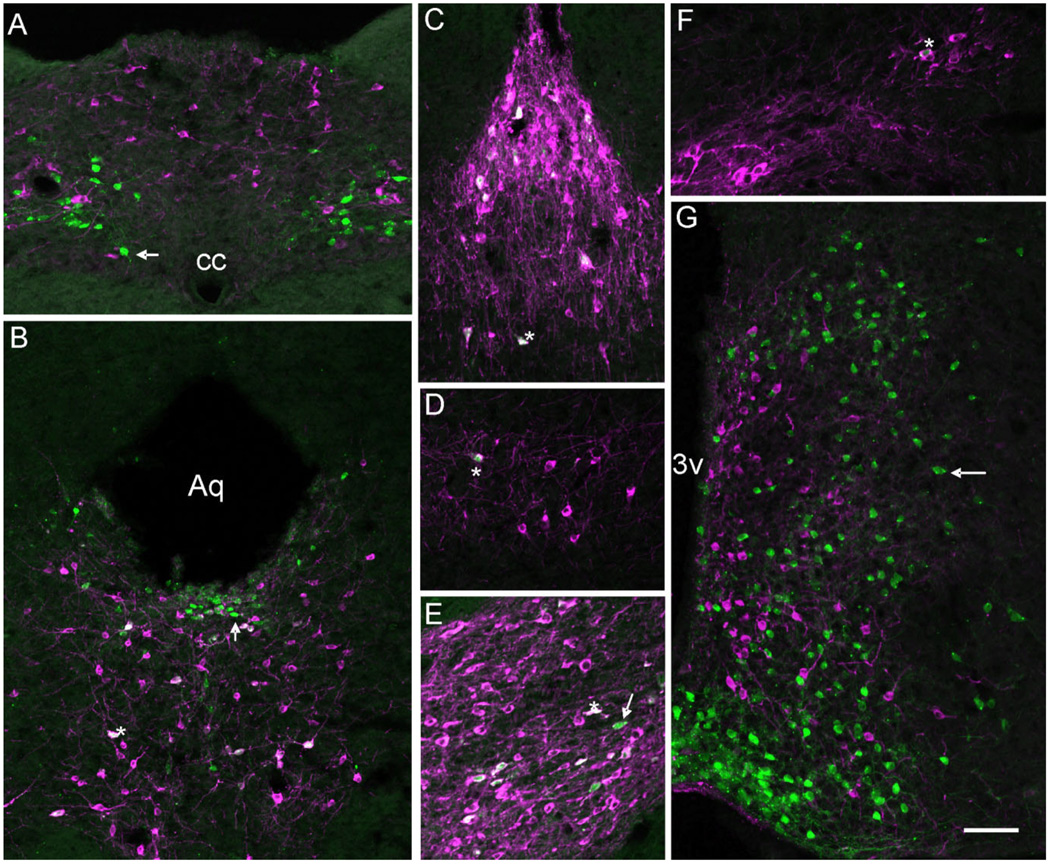
Figure 5.
A series of photomicrographs illustrating the coexpression of tyrosine hydroxylase (TH) and LepRb. A–G: LepRb-Cre LacZ sections labeled for TH (magenta) and LacZ (green) in (A) nucleus of the solitary tract (NTS), (B) the dorsal raphe nucleus (DR) and periaqueductal gray (PAG), (C) in the caudal linear nucleus (Cli), (D) in the A8 nucleus, (E) in the ventral tegmental area (VTA), (F) in the substantia nigra, compact part (SNC), and (G) in the mediobasal hypothalamus. Single-labeled cells appear green or magenta (arrow) while coexpression (asterisk) is indicated by cells appearing white due to color overlay or magenta/white with green nuclei. Aq, aqueduct; 3v, third ventricle; cc, central canal. Scale bar =100 µm.

