
Figure 7.
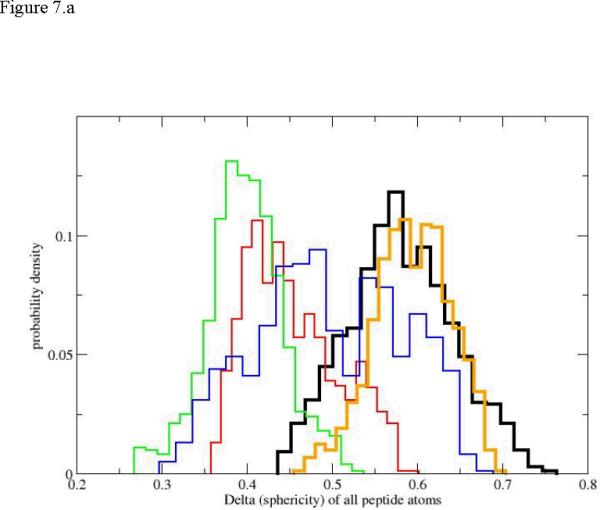
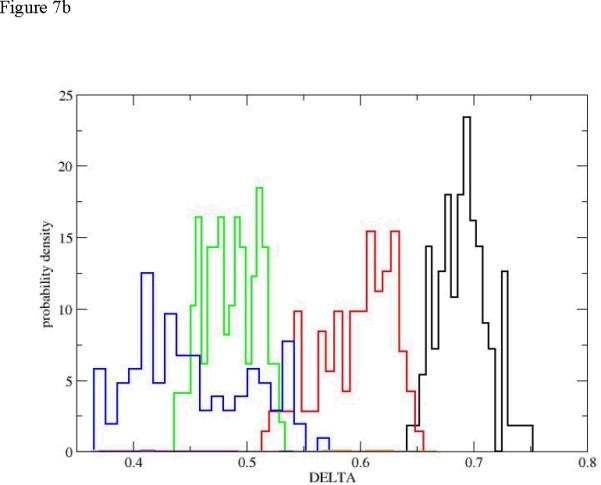
The probability density of the shape measure Δ for the first path. The histograms and colors are the same as in figure 5. 7.a: the complete path. 7.b: path initiation (up to Milestone 18, also only four distributions are used for clarity, no orange).