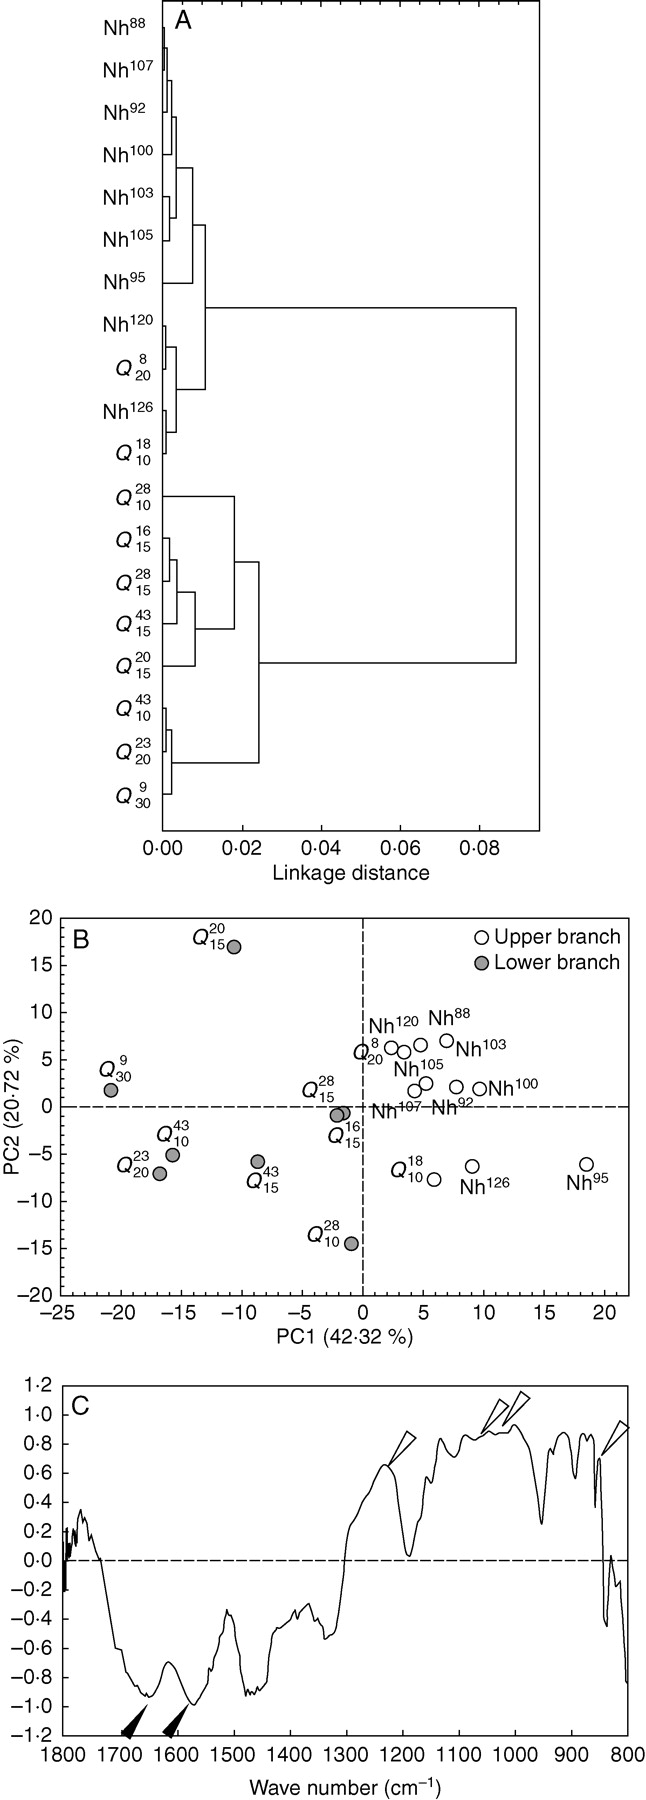
Fig. 2.

Multivariate analyses performed on FTIR spectra from non-habituated and quinclorac-habituated cell walls. (A) Dendrogram obtained by cluster analysis. (B) Representation of PC1 and PC2 from principal component analysis; spectra from the upper and lower branches of the dendrogram from cluster analysis in (A) are indicated. (C) Loading factors for PC1 of PCA represented in (B); open arrowheads show wave numbers related to pectins, solid arrowheads show those related to proteins.
