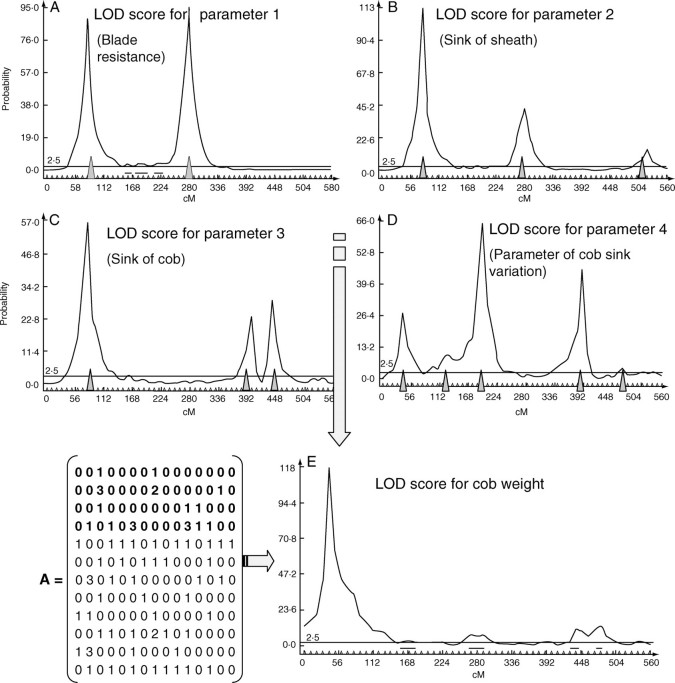
Fig. 4.
QTL detection on four model parameters [Y(1), Y(2), Y(3), Y(4)] and on the corresponding cob weight. The curves show the probability of QTL presence at each marker position along the chromosome (the x-axis gives marker positions in cM). The matrix A coefficients define the effect of each gene on the model parameters. Grey triangles indicate the most probable QTL positions.

