
Fig. 5.
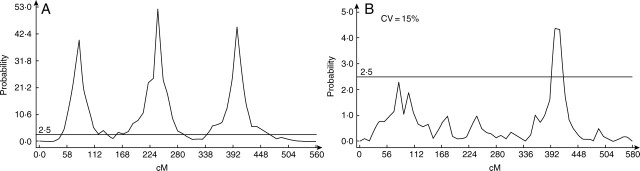
Influence of measurement errors (for parameter values) on QTL detection. The curves show the probability of QTL presence at each marker position along the chromosome (the x-axis gives marker positions in cM). With random white noise on the parameters with a standard deviation equal to 15 %, the quality of QTL detection decreased sharply.