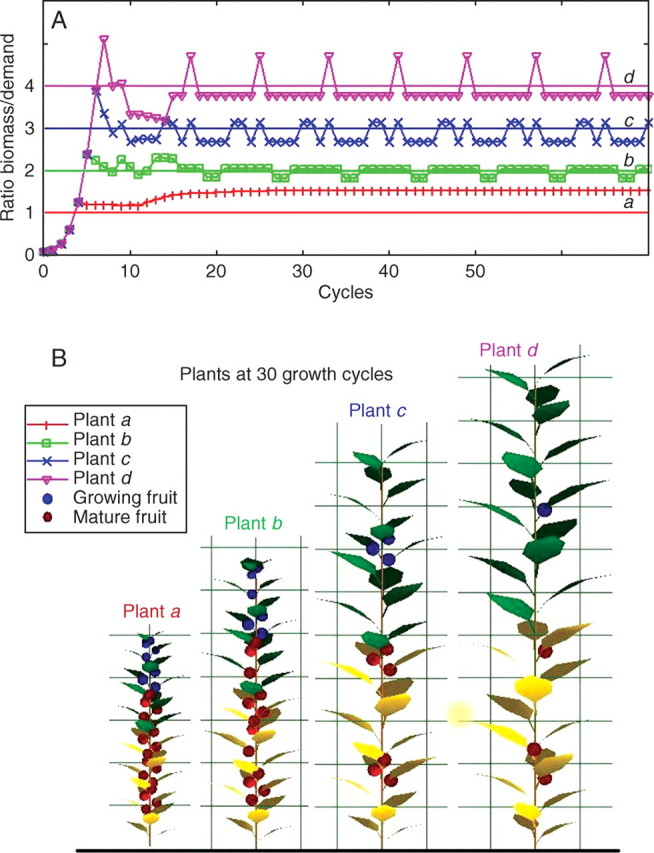
Fig. 3.

Influence of the threshold value of the rate of growth demand satisfaction for appearance of fruit. The behaviours of monocaulus plants are compared with the same entry parameters of the model (A = 3·53 × 10−4, B = 6·67 × 10−2, pe = 0·5, pa = 1, e = 0·025). But fruit appearance is more or less sensitive to the ratio of available biomass to demand. Plants a, b, c and d have, respectively, threshold values of 1, 2, 3 and 4. The lower the threshold is, the more fruits the plant produces and the smaller it is. It is observed that plant d grows much faster at the beginning, before the appearance of fruit. When fruits start to appear, the rate of growth demand satisfaction oscillates around the threshold (B), and rhythms in fructification are observed with different patterns for plants a, b, c and d (A).
