Fig. 4.

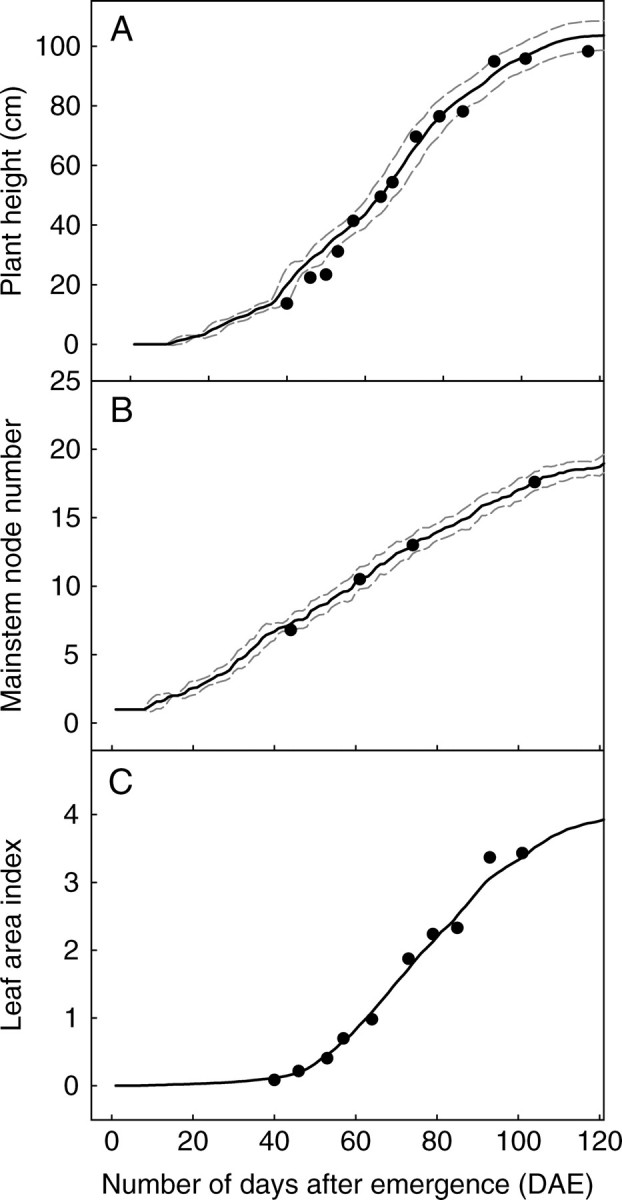
Simulated (points) and observed (lines) changes in (A) number of nodes on the main stem, (B) plant height, and (C) leaf area index. The dotted lines in (A) and (B) indicate s.d. (All data from the 1999 experiment.)

Simulated (points) and observed (lines) changes in (A) number of nodes on the main stem, (B) plant height, and (C) leaf area index. The dotted lines in (A) and (B) indicate s.d. (All data from the 1999 experiment.)