Fig. 5.

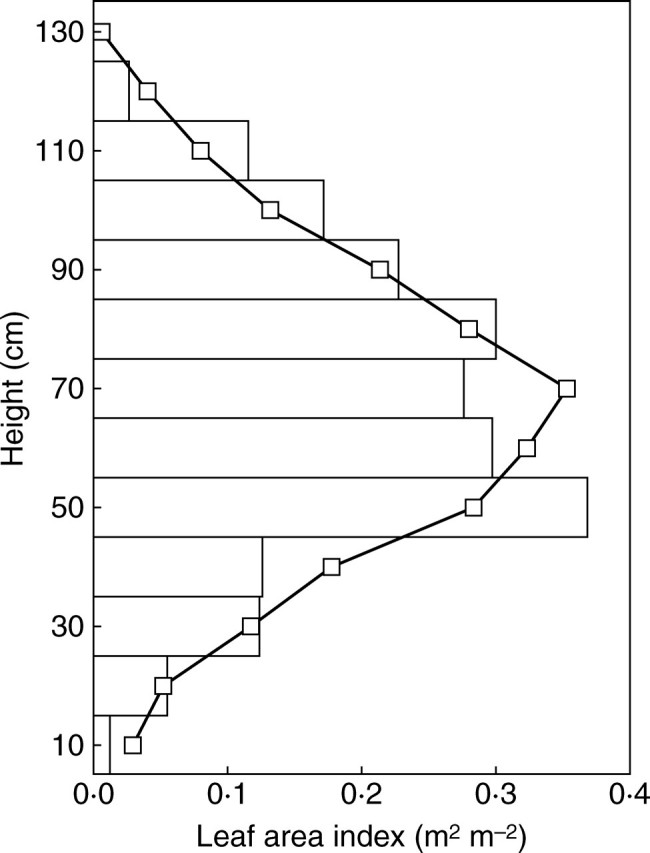
Observed (bars) and simulated (line and squares) vertical profile of leaf area at the time of cut-out in the 1999 experiment.

Observed (bars) and simulated (line and squares) vertical profile of leaf area at the time of cut-out in the 1999 experiment.