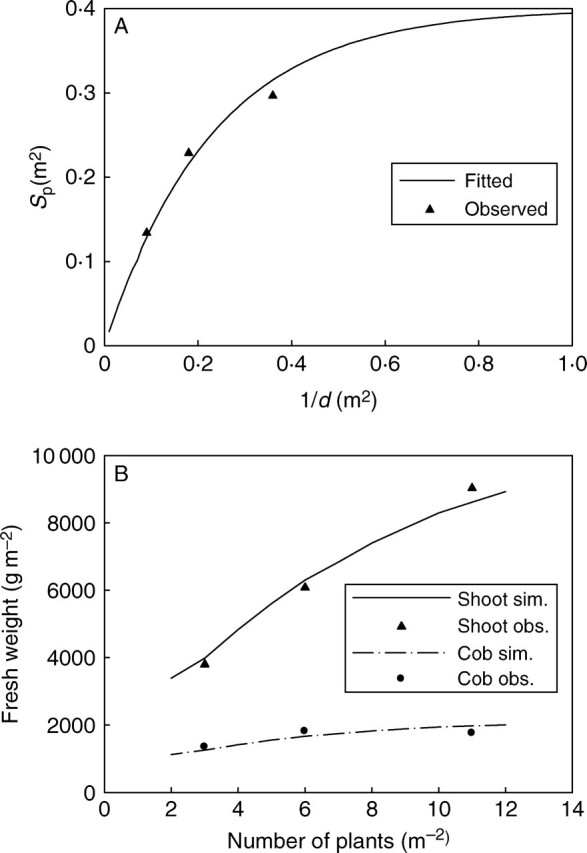
Fig. 6.

(A) The relationship of the projected surface of the plant (Sp) and population density (d) based on data of expt 2005. The values of parameter Sp were fitted using eqn 2 with generalized least square method. (B) Simulated shoot and cob fresh weight for population densities from 2 to 12 plants m−2 for expt 2006 based on the fitted parameter values of expt 2005.
