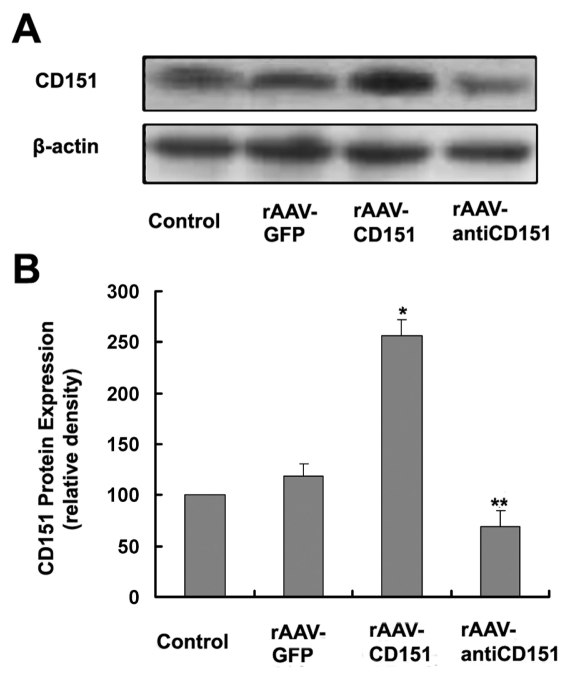
Figure 1.
Myocardial expression of CD151 after CD151 gene delivery. (A) Western blot analysis of CD151 and β-actin. β-actin was used as an internal control. (B) Quantitative analysis of CD151 protein expression. Results show a substantial increase of CD151 proteins in rAAV-CD151 group, but a decrease in the rAAV-antiCD151 group. Data are presented as mean ± SEM (n = ~4–6 per group). *P < 0.05 versus control and rAAV-GFP groups. **P < 0.05 versus rAAV-GFP group.

