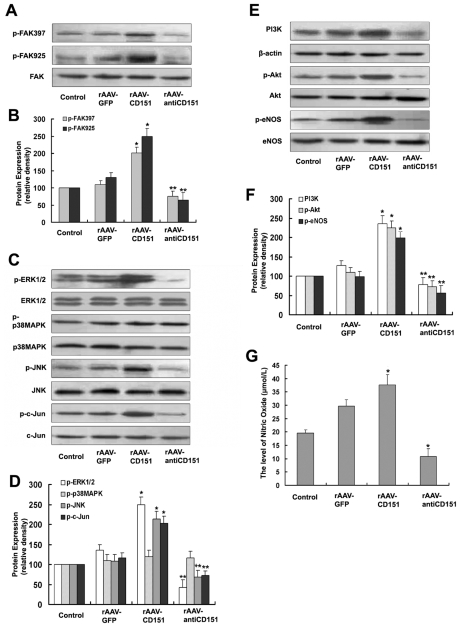
Figure 5.
CD151 activates MAPKs and PI3K signaling pathways. (A) and (B) Levels of FAK, phospho-FAK (Tyr397), and phospho-FAK (Tyr925). (C) and (D) Levels of ERK1/2, phospho-ERK1/2, JNK, phospho-JNK, c-Jun, phospho-c-Jun, p38MAPK, and phospho-p38MAPK. (E) and (F) The levels of PI3K, Akt, phospho-Akt, eNOS, and phospho-eNOS. (G) The level of myocardial NO. Data are presented as mean ± SEM (n = ~4–6 per group). *P < 0.05 versus control and rAAV-GFP groups; **P < 0.05 versus rAAV-GFP group.

