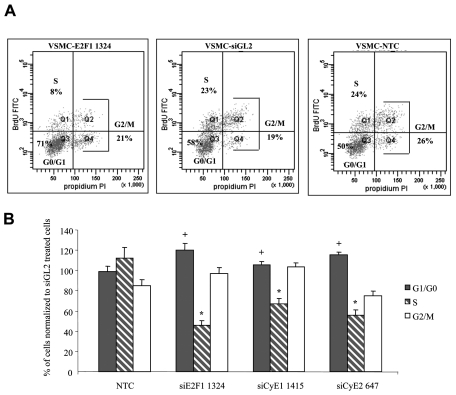
Figure 2. siRNA effects on cell proliferation.
A) Cell cycle phase distribution data were obtained three days after siRNA transfection: a representative example relative to siE2F1-1324 treated CSMCs (donor 1) and its control is reported, BrdU FITC: Ig anti-BrdU labeled by FITC; PI: propidium iodide staining; B) cumulative data for donors 1 and 2 indicate, for all siRNAs, a decrease of S-phase and an increase of G1-G0 phase cells; data for each cell cycle phase are reported as % of the values measured in siGL2 treated cells and are expressed as means ± SEM, n=9. * p< 0.001 and + p< 0.05 compared to control.

